We’ve all heard it before, “the world is moving fast” and it might sound like a cliché, but it’s never been truer.
Anything can change in the blink of an eye, whether it’s employee engagement or client satisfaction.
Keeping up with how people feel about your organization, if you’re a business, nonprofit, or team of any kind, is more important than ever.
That’s where the Net Promoter Score (NPS) comes into play.
Net Promoter Score (NPS) is a straightforward yet effective way to measure the loyalty and satisfaction of both customers and employees.
It helps you understand how people truly feel about your organization, and more importantly, how to turn that feedback into action.
This guide will walk you through what Net Promoter Score is, how it works, and why it matters.
Table of Contents
What Is Net Promoter Score (NPS)?
Let’s start with the basics. What is NPS, you may ask? It’s a simple but incredibly powerful way to measure loyalty and satisfaction. Developed by Bain & Company, Net Promoter Score takes one key question and turns it into actionable data: “How likely are you to recommend our product or service to a friend or colleague?”
This single NPS survey question tells you volumes about customer or employee loyalty. The answers, rated on a scale of 0-10, allow you to classify respondents into three categories:
- Promoters (9-10): These are your biggest fans. They’re enthusiastic, loyal, and most likely to spread the word about how great your company is.
- Passives (7-8): These folks are satisfied but not overly enthusiastic. They like your business, but they aren’t shouting it from the rooftops.
- Detractors (0-6): Ouch. These are the customers who are unhappy, and they might be telling others about their negative experiences.
Stick around as we’ll explore how to calculate NPS and leverage it for actionable insights.
What is Customer NPS?
When people talk about customer NPS, they’re referring to how well your business delights customers. This metric can help you understand how likely your clients are to recommend you.
Tracking customer NPS regularly helps identify areas where you’re excelling and where you could improve.
Unsurprisingly, there are many companies that use NPS as an integral part of their customer success. You can find a list of companies in different industries.
For example, if your customer net promoter score is consistently high, it’s a strong indication that you’re meeting customer expectations, and your reputation will likely grow through word of mouth.
A low score means it’s time to dig into customer feedback and fix what’s broken.
What is Employee NPS?
Employee Net Promoter Score (eNPS) is like the employee version of customer NPS. It measures how likely your employees are to recommend your workplace to others. It’s an excellent way to determine employee satisfaction and workplace culture.
Just like customer NPS, employee NPS divides respondents into promoters, passives, and detractors. The results can offer insights into how engaged your employees feel and whether they’re likely to stick around or leave.
To make the most of eNPS, consider implementing an employee engagement action plan based on the feedback you receive. These plans are all about creating strategies to address concerns and boost morale.
Additionally, using an employee retention survey can provide more detailed insights into specific factors affecting employee satisfaction and retention.
When done right, they can turn those passives and detractors into enthusiastic promoters, making your organization even better for everyone.
How to Calculate Net Promoter Score?
We covered what NPS is, it’s time to talk about the Net Promoter Score formula. Don’t worry, it’s easy math!
Here’s how to calculate NPS:
Net Promoter Score Formula
To calculate your NPS, you’ll need to:
- Survey your customers or employees by asking them how likely they are to recommend your product, service, or organization on a scale of 0-10.
- Group the respondents into promoters (9-10), passives (7-8), and detractors (0-6).
- Calculate the percentages of promoters and detractors (ignoring the passives).
- Subtract the percentage of detractors from the percentage of promoters.
The resulting number is your NPS. The Net Promoter Score formula looks like this:
NPS = % of Promoters – % of Detractors
Net Promoter Score Calculation Example
Here’s a quick net promoter score calculation example:
Let’s say you’ve surveyed 100 customers:
- 60 customers gave you a 9 or 10 → 60% Promoters
- 20 customers gave you a 0 to 6 → 20% Detractors
- The remaining 20% are passives, but we don’t include them in the NPS calculation.
Now, subtract the percentage of detractors from promoters:
NPS = 60% – 20% = 40
Your NPS score is 40!
What is the Purpose of Measuring Net Promoter Score?
So why should you bother with measuring net promoter score? Well, NPS helps you get straight to the heart of customer or employee sentiment. It’s like having a pulse check on loyalty whether it’s customer or employee loyalty.
For organizations, a high NPS means you’re delivering great customer experiences, while a low NPS flags that something needs attention.
For HR teams, employee NPS is a tool for tracking morale and engagement, which are critical for retaining top talent.
How to Interpret Net Promoter Score?
Now that you’ve got your NPS, the next step is understanding what it means for your business. But it’s not just about the number itself, context is key. That’s where benchmarking comes in.
Benchmarking helps you compare your NPS against industry standards, competitors, and your past performance. This gives you a clearer idea of whether your score is great, just okay, or needs work.
Industry-Specific Benchmarks: Different industries have different expectations for what a “good” NPS looks like. Looking at the average NPS in your industry will give you a clearer idea of how you’re doing.
Competitive Benchmarking: It’s not just about hitting the industry average, it’s also important to see how your NPS stacks up against your competitors. Even if your score is above the industry benchmark, being below key competitors means there’s still room for improvement, and you could be losing customers to them.
Historical Benchmarking: Keeping an eye on how your NPS changes over time is a smart way to track your progress. Look at how stable your score is or if it’s swinging up and down. These trends can give you valuable insights into how your customer satisfaction and loyalty are evolving.
To give you a good start check the companies that use NPS and Bain and Company’s NPS reports.
With your benchmark and Net Promoter Score (NPS) set, it’s time to explore what these figures reveal:
A negative NPS (below 0) indicates that you have more detractors than promoters, suggesting that most of your customers are dissatisfied. This puts you at risk of losing customers to competitors.
An NPS between 0 and +50 means you’re doing well, but there’s still room for improvement. While most customers are likely satisfied, there may be enough detractors to require attention. Focus on addressing their negative feedback and turning passives into promoters.
An NPS of +50 or higher shows you’ve established a strong base of loyal customers who are willing to recommend your organization. The higher the score, the more likely you have a competitive advantage and high customer satisfaction.
Benchmarking offers the context needed for a thorough interpretation of your NPS, helping you set targeted goals and focus on areas that will drive meaningful growth.
What Is a Good Net Promoter Score?
A common question is: What is a good NPS score? Generally speaking, a score above 0 is considered positive. A score above 50 is excellent. And if you’re scoring above 70, you’re in the upper echelon of customer satisfaction and loyalty.
What Is a Bad Net Promoter Score?
On the flip side, a bad NPS score is anything below 0. This means you have more detractors than promoters. In this case, it’s crucial to gather feedback and address areas of dissatisfaction quickly.
What Are the Benefits of Using Net Promoter Score?
NPS offers some fantastic advantages for both organizations and employees. Let’s break down the benefits of net promoter score:
- Simple to use: A single question provides powerful insights.
- Tracks loyalty: NPS lets you measure loyalty over time and identify trends.
- Improves customer/employee retention: Addressing detractor concerns helps improve both customer and employee retention.
- Informs strategic decisions: NPS data can guide service or policy changes that keep people happy.
- Benchmarking: NPS allows you to compare your score against competitors in your industry.
How to Calculate NPS in Excel?
If you’re new to calculating Net Promoter Score (NPS) and want to use Excel, here’s a step by step guide with formulas to help you through the process:
- Collect Your Data:
- First, gather all the responses from your NPS survey. These responses are usually on a scale from 0 to 10.
- Enter the Scores into Excel:
- Open Excel and type your survey responses into a single column (for example, Column A). Each row should have one response.
- Categorize the Responses:
- To make sense of the data, you’ll need to classify each score into three groups:
- Promoters: Scores of 9-10
- Passives: Scores of 7-8
- Detractors: Scores of 0-6
- You can use Excel formulas to automatically sort these responses into the correct categories. Use this formula in B2 and drag it down:
- =IF(A2>=9; “Promoter”; IF(A2>=7; “Passive”; “Detractor”))
- To make sense of the data, you’ll need to classify each score into three groups:
- Count Promoters, Passives, and Detractors:
- Use the following formulas to count how many respondents fall into each category:
- Promoters: =COUNTIFS(A2:A100,”>=9″,A2:A100,”<=10″)
- Detractors: =COUNTIFS(A2:A100,”>=0″,A2:A100,”<=6″)
- Passives: =COUNTIFS(A2:A100,”>=7″,A2:A100,”<=8″)
- Use the following formulas to count how many respondents fall into each category:
- Calculate Total Responses:
- Next, use the following formula to calculate the total number of responses:
- =COUNTA(A2:A100)
- Next, use the following formula to calculate the total number of responses:
- Calculate NPS:
- Finally, calculate your Net Promoter Score using the following formula, replacing Promoters, Detractors, and Total Responses with the actual counts or their cell references:
- =ROUND(((Promoters – Detractors) / Total Responses) *100; 2)
- Finally, calculate your Net Promoter Score using the following formula, replacing Promoters, Detractors, and Total Responses with the actual counts or their cell references:
Free NPS Excel Template
For those who’d rather skip the formula juggling in Excel, come and get our Net Promoter Score calculation template!
How to Conduct eNPS Surveys inside Microsoft Teams?
Alright, we’ve come this far, and it’s clear that Employee Net Promoter Score (eNPS) is crucial! Understanding how your employees feel about your organization allows you to refine your people strategy and build a more positive workplace.
To make eNPS a core part of assessing employee engagement, it’s best to integrate it into your daily workflow, especially within your primary communication channel.
If you’re using Microsoft Teams, Teamflect is your ultimate engagement tool. The best part? You can start using Teamflect for free, with full functionality for up to 10 users and no time limits!
Find Out Your Employee NPS Within Microsoft Teams
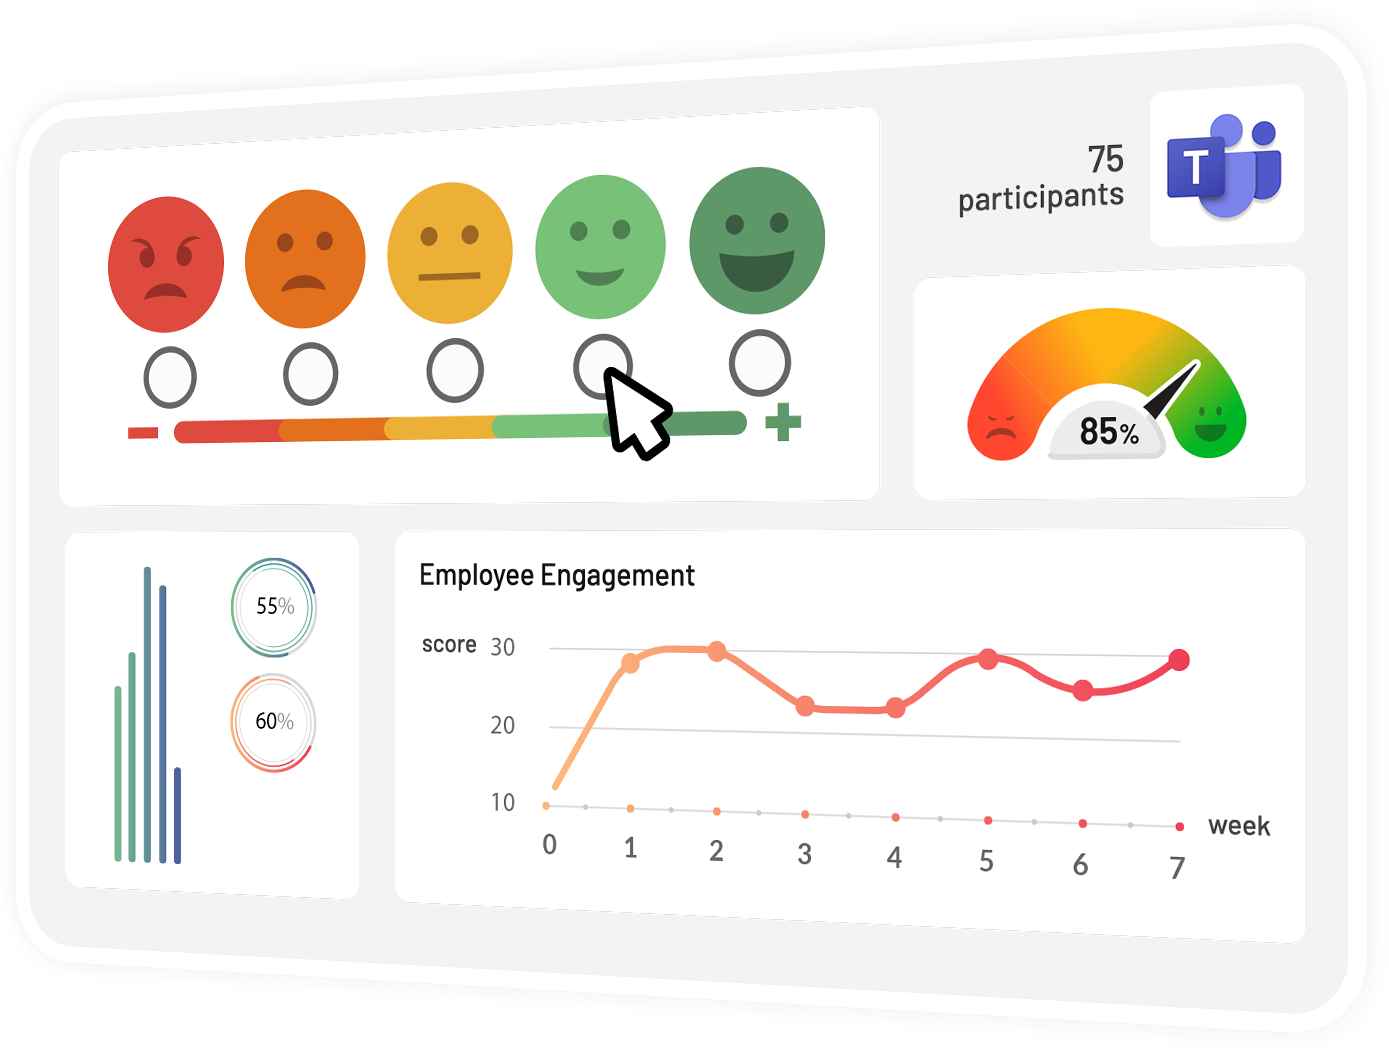
Teamflect makes tracking and managing employee engagement smooth.
We have a customizable survey template gallery where you can send:
- eNPS surveys
- Pulse surveys
- Anonymous surveys
- Exit Surveys
and so much more directly from Microsoft Teams!
Review insights with Power BI-powered reports, and make quick, informed decisions, all without stepping outside your main communication channel.
If you’re dedicated to boosting employee engagement and loyalty, Teamflect is the solution for you. Discover how easy and effective employee feedback can be!