We’ve already talked about pulse survey examples, employee pulse survey questions, and best employee survey tools –but what about analyzing the pulse survey results you gathered from these? At its core, employee pulse surveys are done in order to collect data and act according to the results to better your workplace.
But first, let’s kick off this post with a quick rundown of employee pulse surveys. In case you’re not familiar with or remember it, these surveys are a way to gauge how your employees are feeling about their work, the company, and their overall satisfaction. Essentially, they help you get a pulse on the overall health of your organization. Cool, right?
Now, you might be wondering, “Why should I bother analyzing pulse survey results?” Well, my friend, the answer is simple: it’s the key to unlocking insights that can help you make positive changes in your workplace.
By taking the time to carefully examine and understand the data you’ve collected, you’ll be able to identify trends, problem areas, and opportunities for improvement. Plus, by showing your employees that you’re taking their feedback seriously, you’ll be building a culture of trust and transparency. A win-win for both parties involved!
So, what can you expect from this post? Well, we’re going to walk you through the process of analyzing employee pulse survey results step by step. We’ll cover everything from preparing for analysis to organizing the data to interpreting the results and even acting based on what you learn.
By the end of this post, you’ll have a solid understanding of how to make the most of your employee pulse survey data and use it to drive positive change in your organization. So, let’s get started, shall we?

Table of Contents
Analyzing Employee Survey
Decide on your analysis method
The first step if you want to analyze pulse survey results is deciding on the method you will use. This might sound intimidating, but don’t worry – there are a variety of methods you can use depending on your level of expertise and the complexity of the data.
Some people prefer to use simple methods like tallying responses, while others may prefer to use more complex statistical analyses.
The important thing is to choose a method that feels comfortable and manageable for you to be able to dive into the data with confidence and start drawing meaningful insights. So, take a deep breath, choose your method, and let’s get started!
Categorize the responses
Categorizing the responses means taking the individual survey responses and grouping them together based on the questions asked. Doing this will help you identify patterns and trends in the data, which can be incredibly valuable in gaining insights into your employees’ perspectives.
The good news is that categorizing responses is relatively straightforward –all you need to do is create a table or spreadsheet and organize the data according to the different questions asked.

Create visualizations
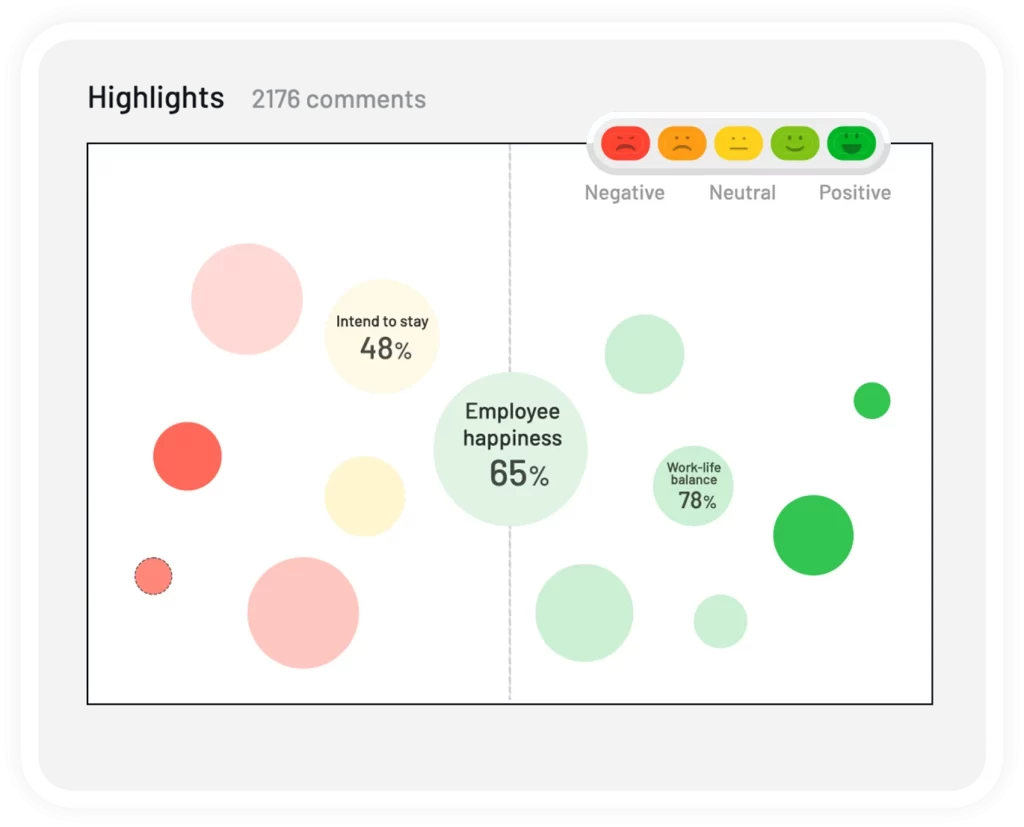
With your responses categorized, it’s time to start visualizing the data. This step is where things get exciting –by creating charts, graphs, and other visualizations, you’ll see the data in a new light. Visualizations can help you spot trends and patterns that might not have been clear in the raw data.
Plus, they’re a great way to communicate your findings to others in a clear and compelling way. Don’t worry if you’re not a designer –there are plenty of tools out there that can help you create beautiful visualizations even if you’re not a pro.
Use employee engagement survey software
Using a tool like Teamflect can help you accelerate your journey by streamlining the process of designing and distributing surveys, analyzing survey results, and identifying action items.
With the help of a pulse survey tool, you can seamlessly incorporate employee pulse surveys into your work routine without increasing workload or stress.
Teamflect is an all-in-one employee engagement tool that offers a comprehensive solution for pulse surveys, all within a single app. One of its key features is being the best employee engagement tool for Microsoft Teams, making it a popular choice for teams who use this platform.
Teamflect enables highly efficient one-on-one meetings with built-in task assignments and note-taking tools, streamlining the communication and collaboration process. Its user-friendly design makes it easy to use for all team members, while customizable and automated review cycles with built-in templates help to enhance productivity.
You can easily analyze your pulse survey results without a hassle with Teamflect’s Power BI reports!


