.svg)
.svg)
Free 9-Box Grid Templates in Excel + PDF

Updated on:
September 18, 2026

Prefer Teamflect as your HR source on Google
.svg)

The 9-box grid plots employees on two axes, performance and potential, into nine cells that show who is ready for more, who needs support, and where your future leaders sit today.
This article provides a complete 9-box implementation: six free templates (Excel, PowerPoint, PDF, Word) ready to download, plus a practical playbook for defining performance and potential before you calibrate, reducing bias in the review, and turning placements into real development and performance plans once the meeting ends.
Eight templates are below: five spreadsheets, a fillable PDF, a Word file and a slide deck. Each one uses the same nine cells and the same axis order, so a grid started in Excel can be finished in the deck without renumbering anything. Two of the spreadsheets carry formulas that place a person automatically once you enter a performance score and a potential score.
The 9-box grid is a talent assessment matrix that plots employees on two axes: current performance on the X-axis and future potential on the Y-axis. Each axis has three levels (low, moderate, high), which creates nine cells.
Where someone lands tells you what kind of investment the role and the person need from the business: development, stretch, retention, or course-correction.
With the way the 9-box grid is set up, it lets organizations clearly visualize where employee performance and employee potential overlap. Let's take a look at the grid itself to get a better understanding of 9-box grid succession planning:
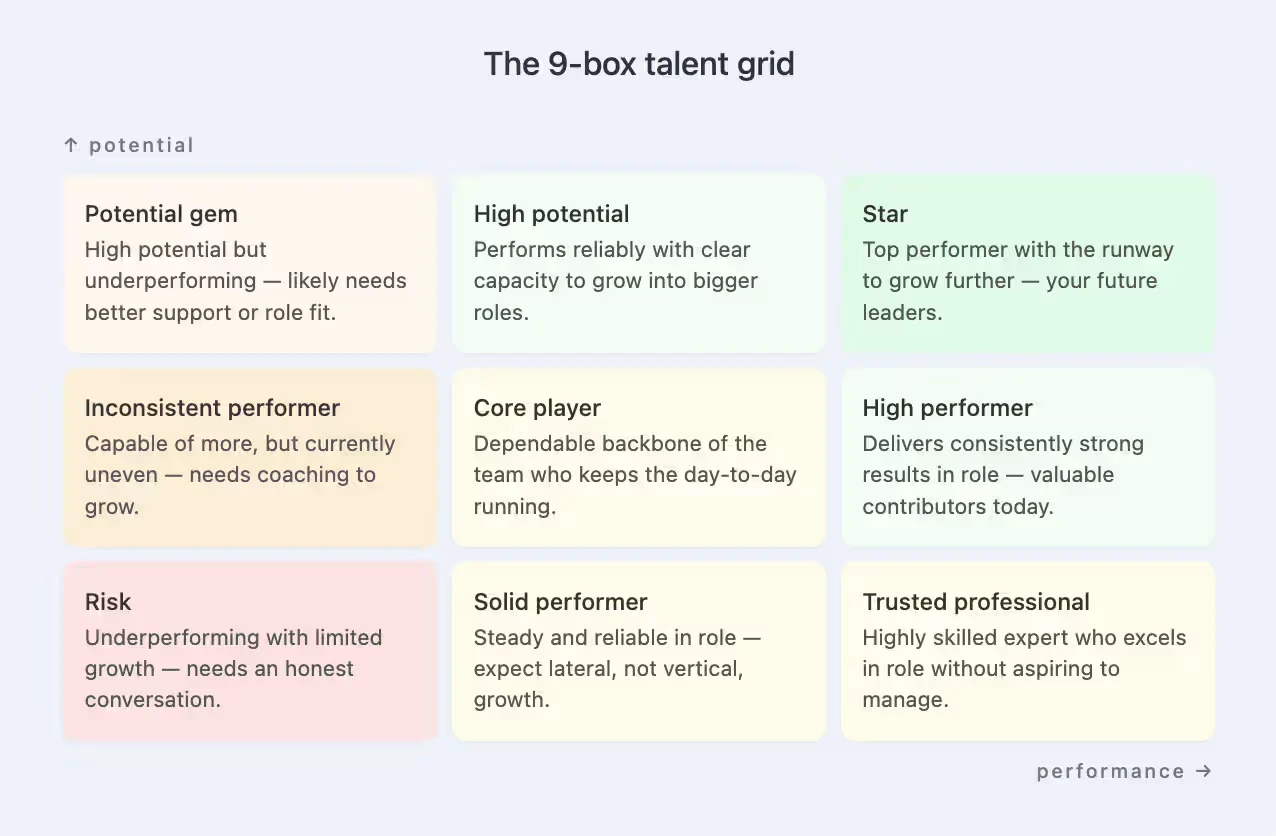
The X-axis represents performance against current role expectations. The Y-axis represents potential to take on broader scope, more complex work, or a more senior level. The corners do most of the storytelling.
Top-right is where future leaders sit, the people consistently delivering at high performance with the headroom to take on more. The bottom-left cell is the inverse, and usually triggers a performance improvement plan or a role change.
The middle of the grid is where most of your team will land, and that is the design working as intended. A function staffed entirely with high-potential, high-performing talent creates internal competition and avoidable attrition. Steady performers in clearly defined roles are what keeps the work moving.
The framework earns its place because it forces one structured conversation about two qualities that get discussed separately too often. Once an employee's position is mapped, the next conversation gets sharper. Coaching, promotion path, retention risk, or an exit plan can all be weighed with performance and potential visible at the same time, rather than traded off one at a time across different review cycles.
The grid is usually credited to McKinsey, which built the framework for General Electric in the 1970s to compare business units before it was adapted to compare people. That origin is why the language still leans on portfolio words like investment and divestment rather than development words.
The 9-box grid is called outdated because it rates potential, which nobody can measure directly, on the same nine-cell scale as performance, which is already recorded and auditable.
Are there any disadvantages to using a nine-box grid for succession planning? Sure. The 9-Box Grid also has some limitations that must be kept in mind. As a subjective evaluation, the 9-Box Grid results can vary depending on what biases and perspectives the evaluator brings to the table.
More than half of employees (51%) say their annual performance reviews are biased or inaccurate, and 87% report that unfair ratings reduce their engagement, which shows why any 9-box discussion should be grounded in clear criteria and multiple data sources.
Even though it's valuable, it should be used along with other tools and strategies as part of a succession planning process.
You didn’t think that we would go on and on about the benefits of using 9-box grid templates without providing you with some, did you? Here are some free 9-box grid templates for you to use!
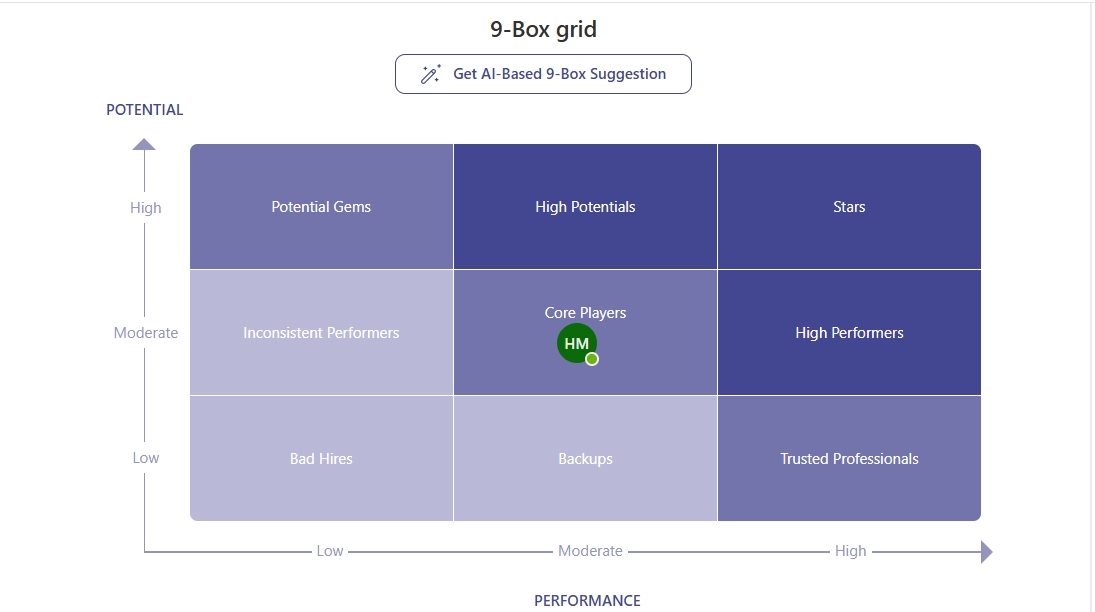
Best for: Teams that don’t want to work with static Excel files and prefer an interactive 9-box grid that lives inside their existing performance review process in Microsoft Teams.
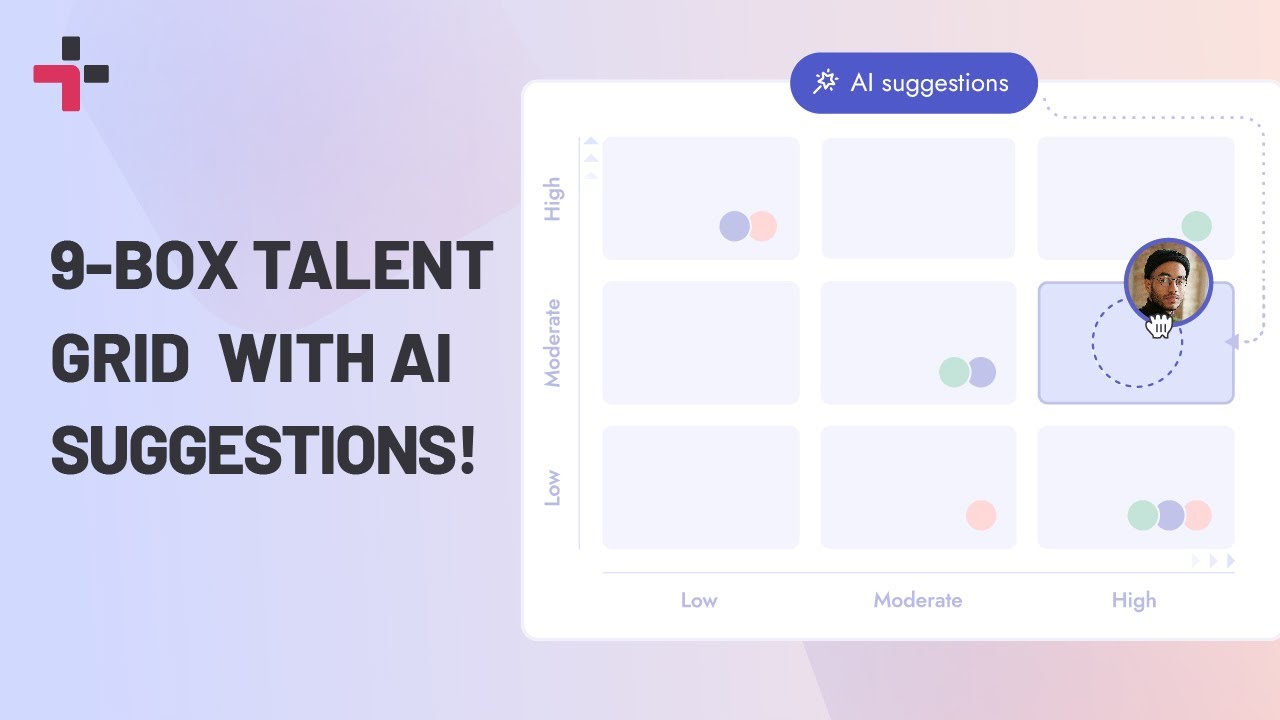
What's inside: a live 9-box view in Microsoft Teams, the same axis order as the spreadsheets below, AI-suggested placement, and employee data pulled automatically from the review so a talent calibration session never starts with a blank grid.
Key features
Why choose this template
Unlike the other templates on this list, Teamflect’s 9-box grid isn’t a standalone Excel document. Because it’s part of Teamflect’s performance review templates, all the relevant employee data is already there when you open the grid. This removes the need for repetitive data entry and lets you focus on analyzing results and planning next steps instead of managing spreadsheets.
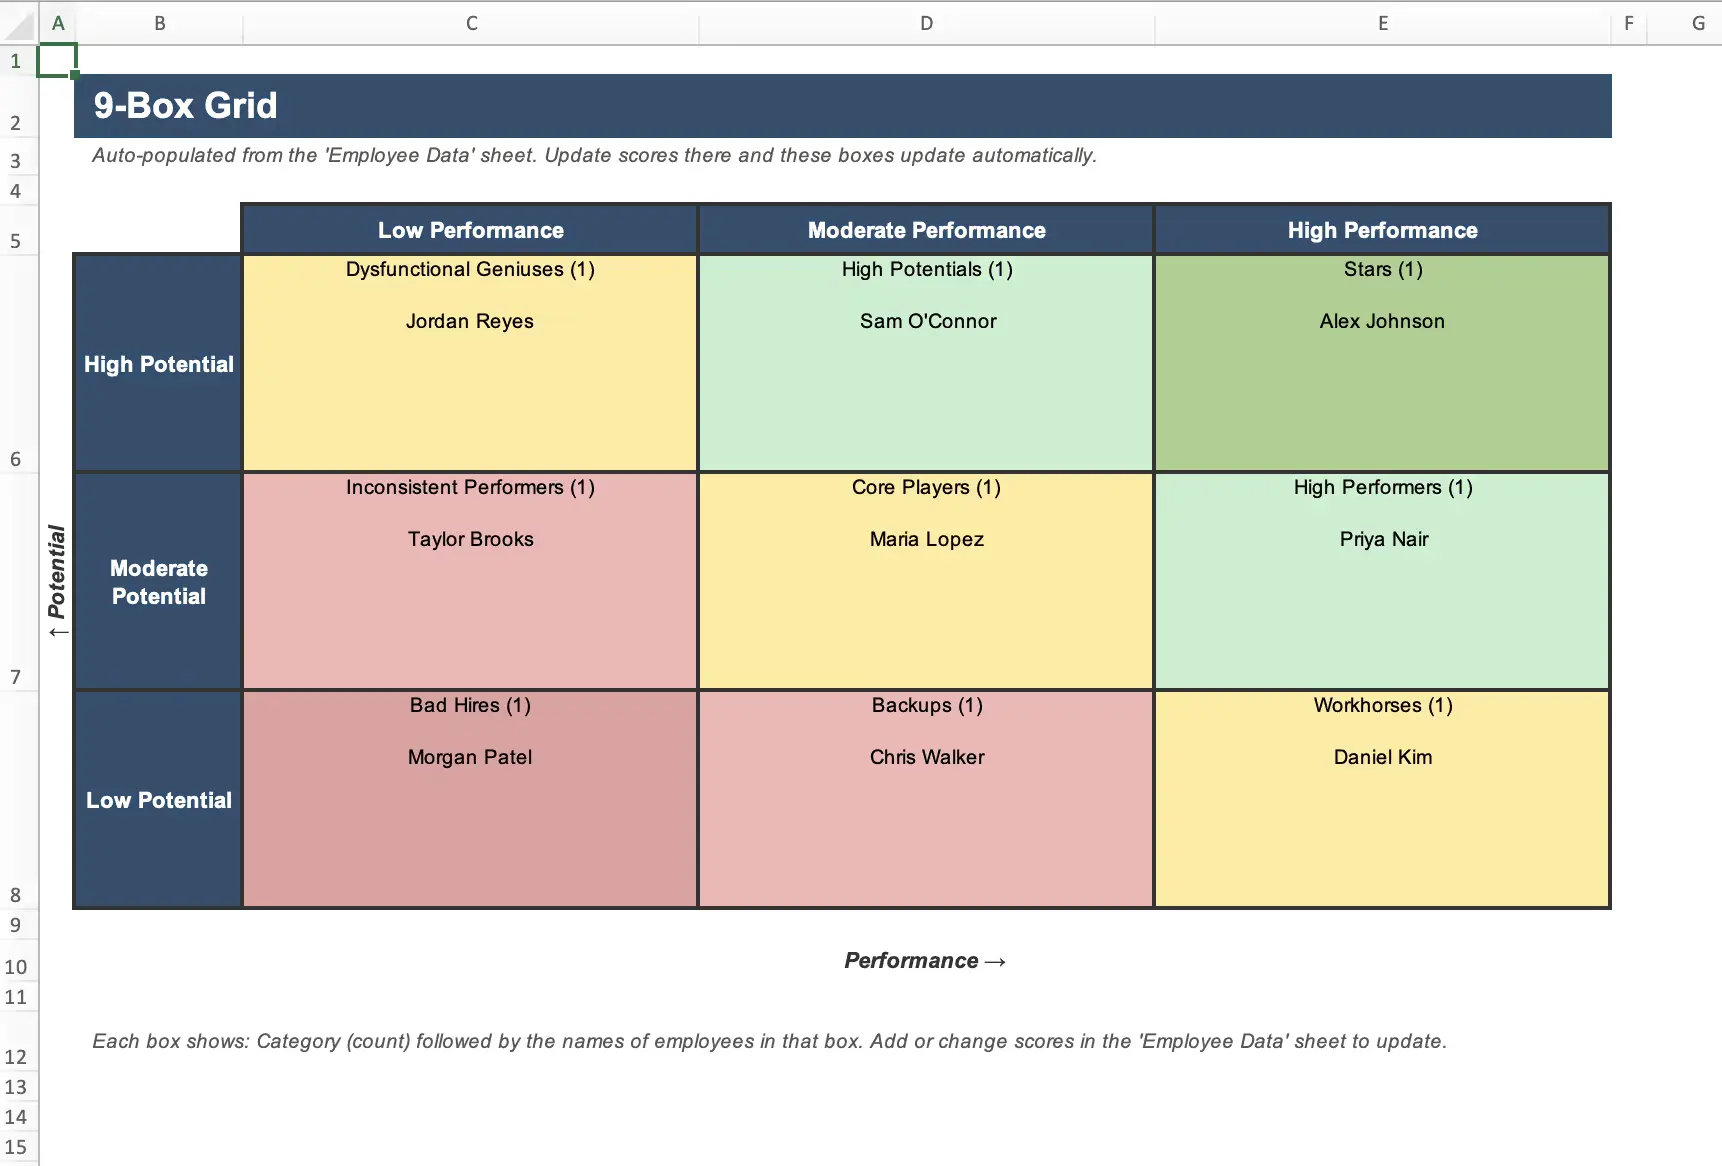
Best for: Teams who already work in Excel and want a 9-box matrix that handles the categorization work automatically. Score every employee on Performance and Potential and the grid places them in the right cell.
What's inside: two tabs, a 1 to 3 rating scale on both axes, a lookup formula that drops each name into the right box, and space for fifty employees, enough for one full talent review cycle without duplicating the sheet.
Key features
Why choose this template: The visual layout is plain by design. What it offers instead is full automation. Score the roster and the assessment matrix updates without any drag-and-drop, which keeps reviews repeatable across cycles and removes the drift that comes from manually placing names into cells.
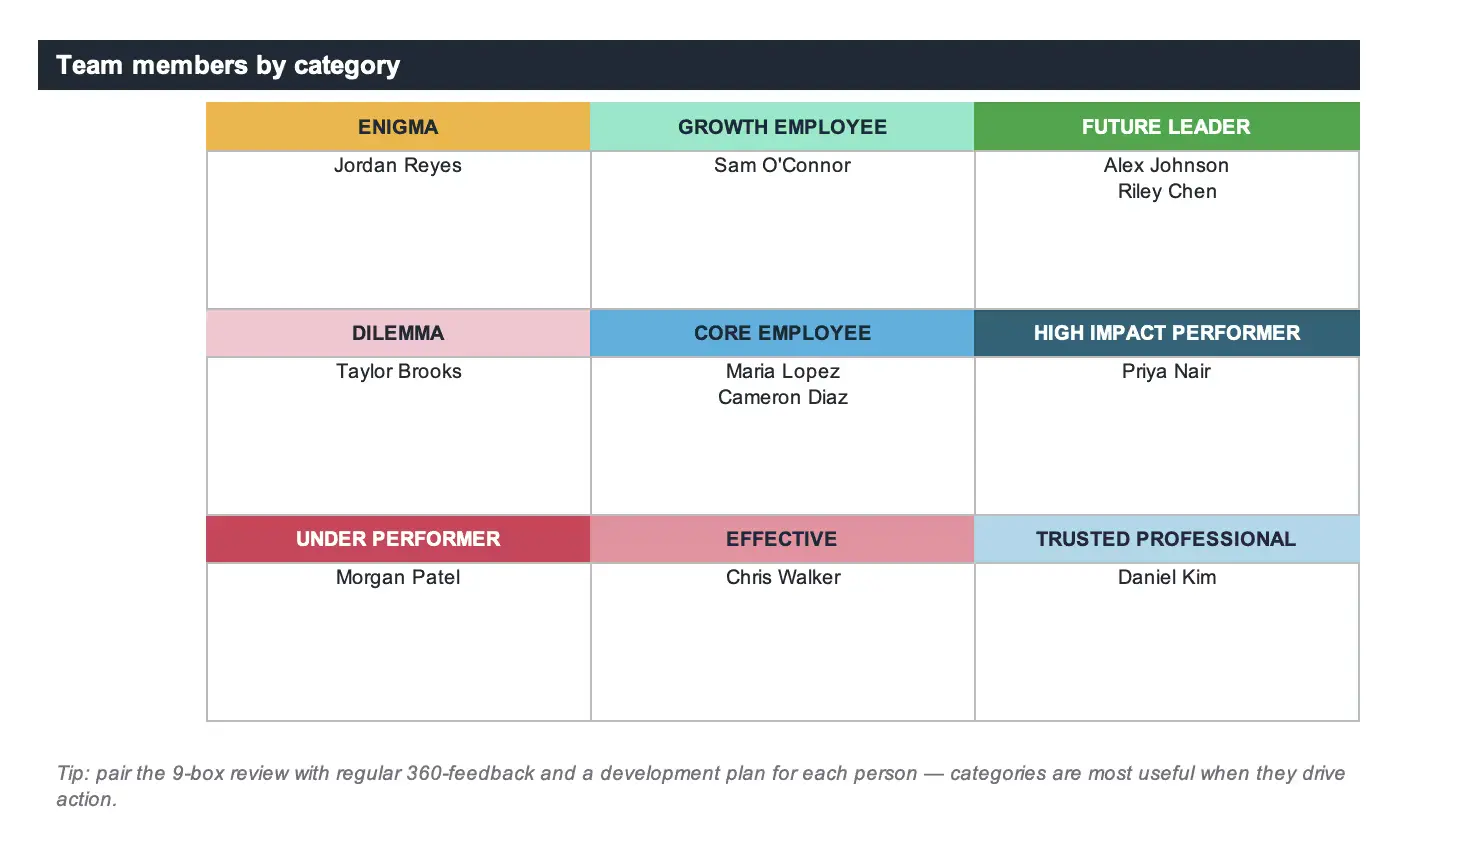
Best for: Teams that want a polished, dashboard-style 9-box matrix with vivid color blocks and a category-by-category headcount view. Manual category assignment makes it a strong fit for smaller groups where every placement is discussed individually.
What's inside: two tabs, a dropdown rating for each of the nine categories instead of a numeric scale, live per-box counts and percentages for the whole talent distribution, and room to relabel every category with your own names.
Key features
Why choose this template: Manual placement gives reviewers more control than score-driven categorization. The result is a presentation-ready talent mapping dashboard that drops straight into a leadership review without further formatting.
Best for teams who run their talent mapping reviews in slides instead of spreadsheets, or who need to drop the grid into a longer leadership presentation.
What's inside: four editable slides, no numeric scale since placement is manual, a recommended-actions slide that doubles as the placement rationale for the room, and a consistent color palette across the deck.
Key features
Why choose this template: Slides change the conversation. Excel is for capturing scores. A deck is for presenting decisions. Each box is a real shape rather than a flattened image, so reviewers can drop in names, change categories to match an internal naming convention, or pull the matrix into a longer leadership presentation without rebuilding from scratch.
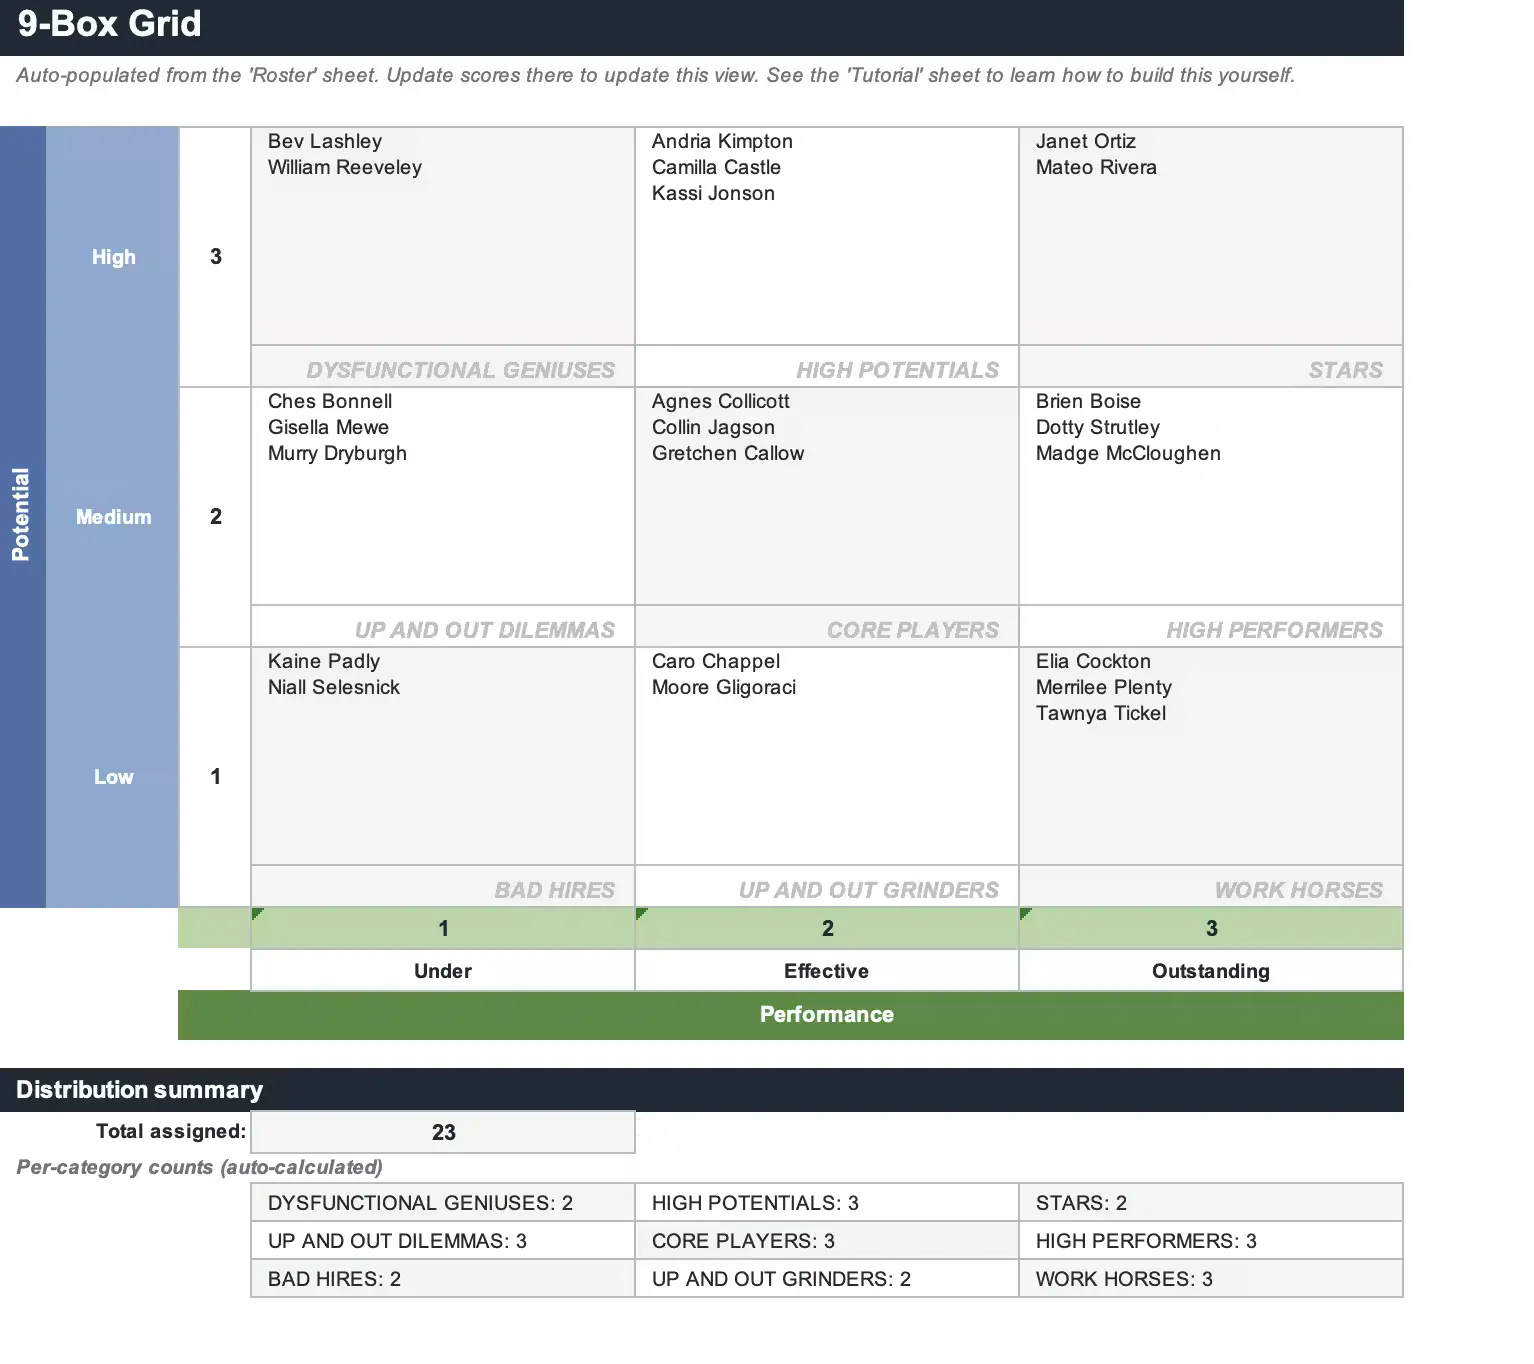
Best for: Excel users who want a working editable 9-box talent matrix and want to understand how it was built, so they can recreate or adapt it for future reviews.
What's inside: three tabs, a 1 to 3 scale on both the performance and potential axes, an array formula that auto-populates each cell, and 23 sample employees preloaded so the grid isn't empty on first open.
Key features
Why choose this template: The tutorial is the differentiator. Most templates hand you a finished file and stop there. This one walks through the array-formula entry rules, the styling choices, and how to filter the grid by department, so the next time you need a similar tool you can build it yourself rather than hunt for another download.
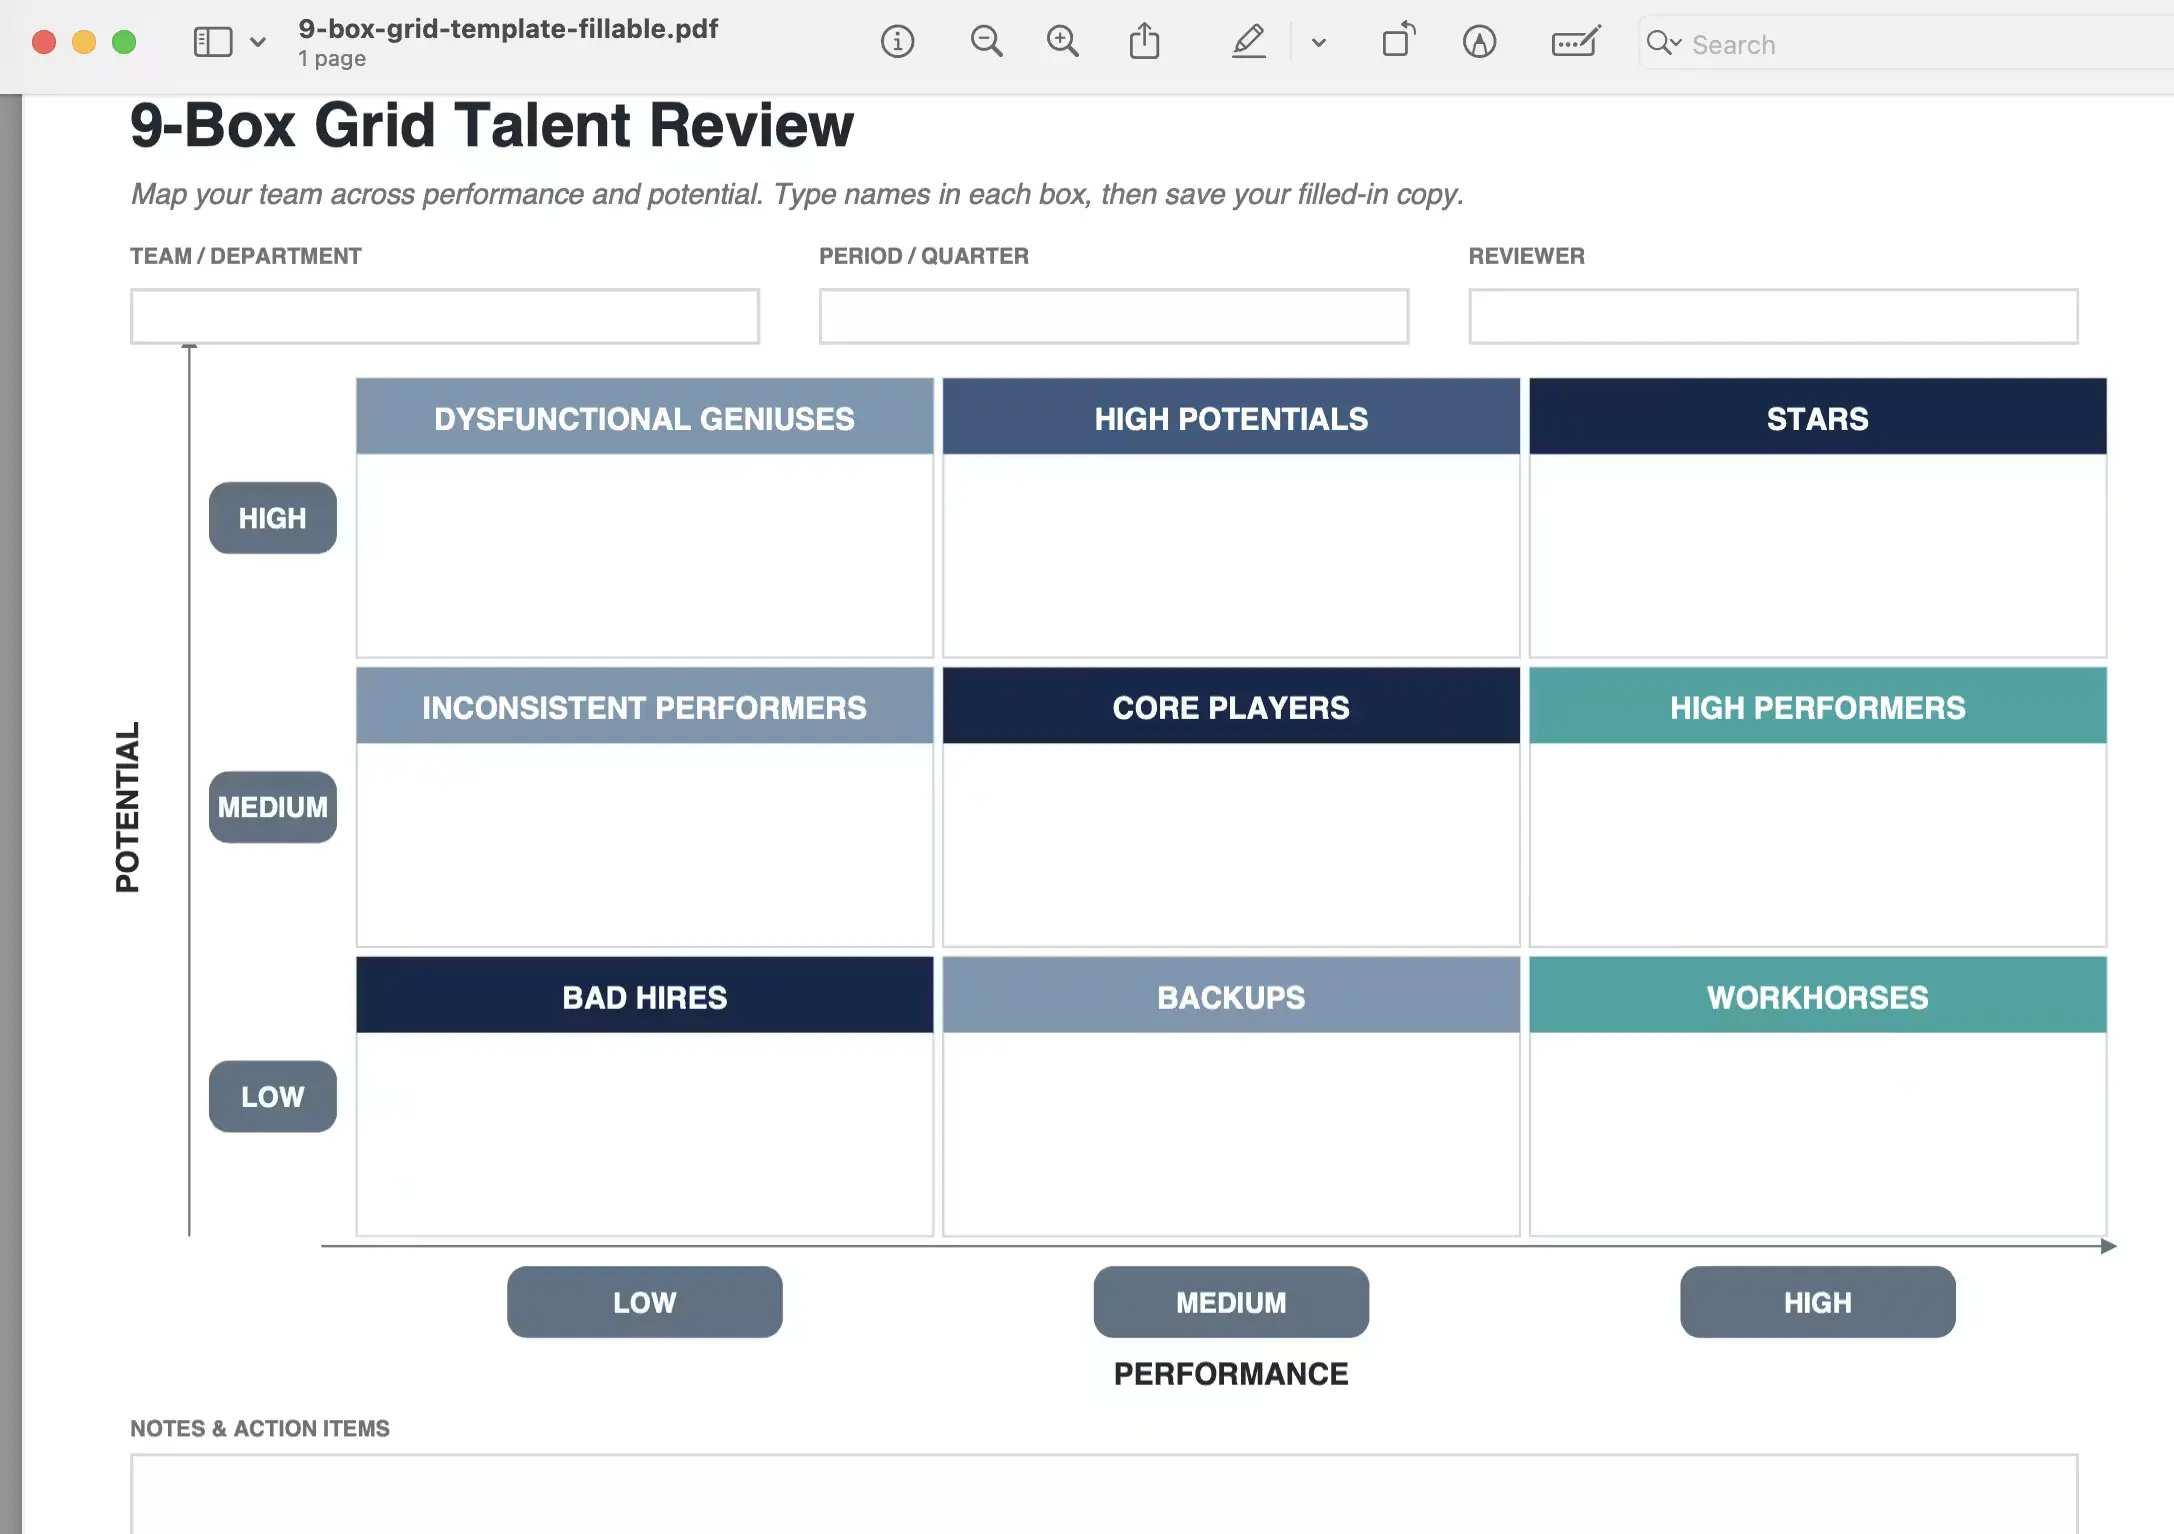
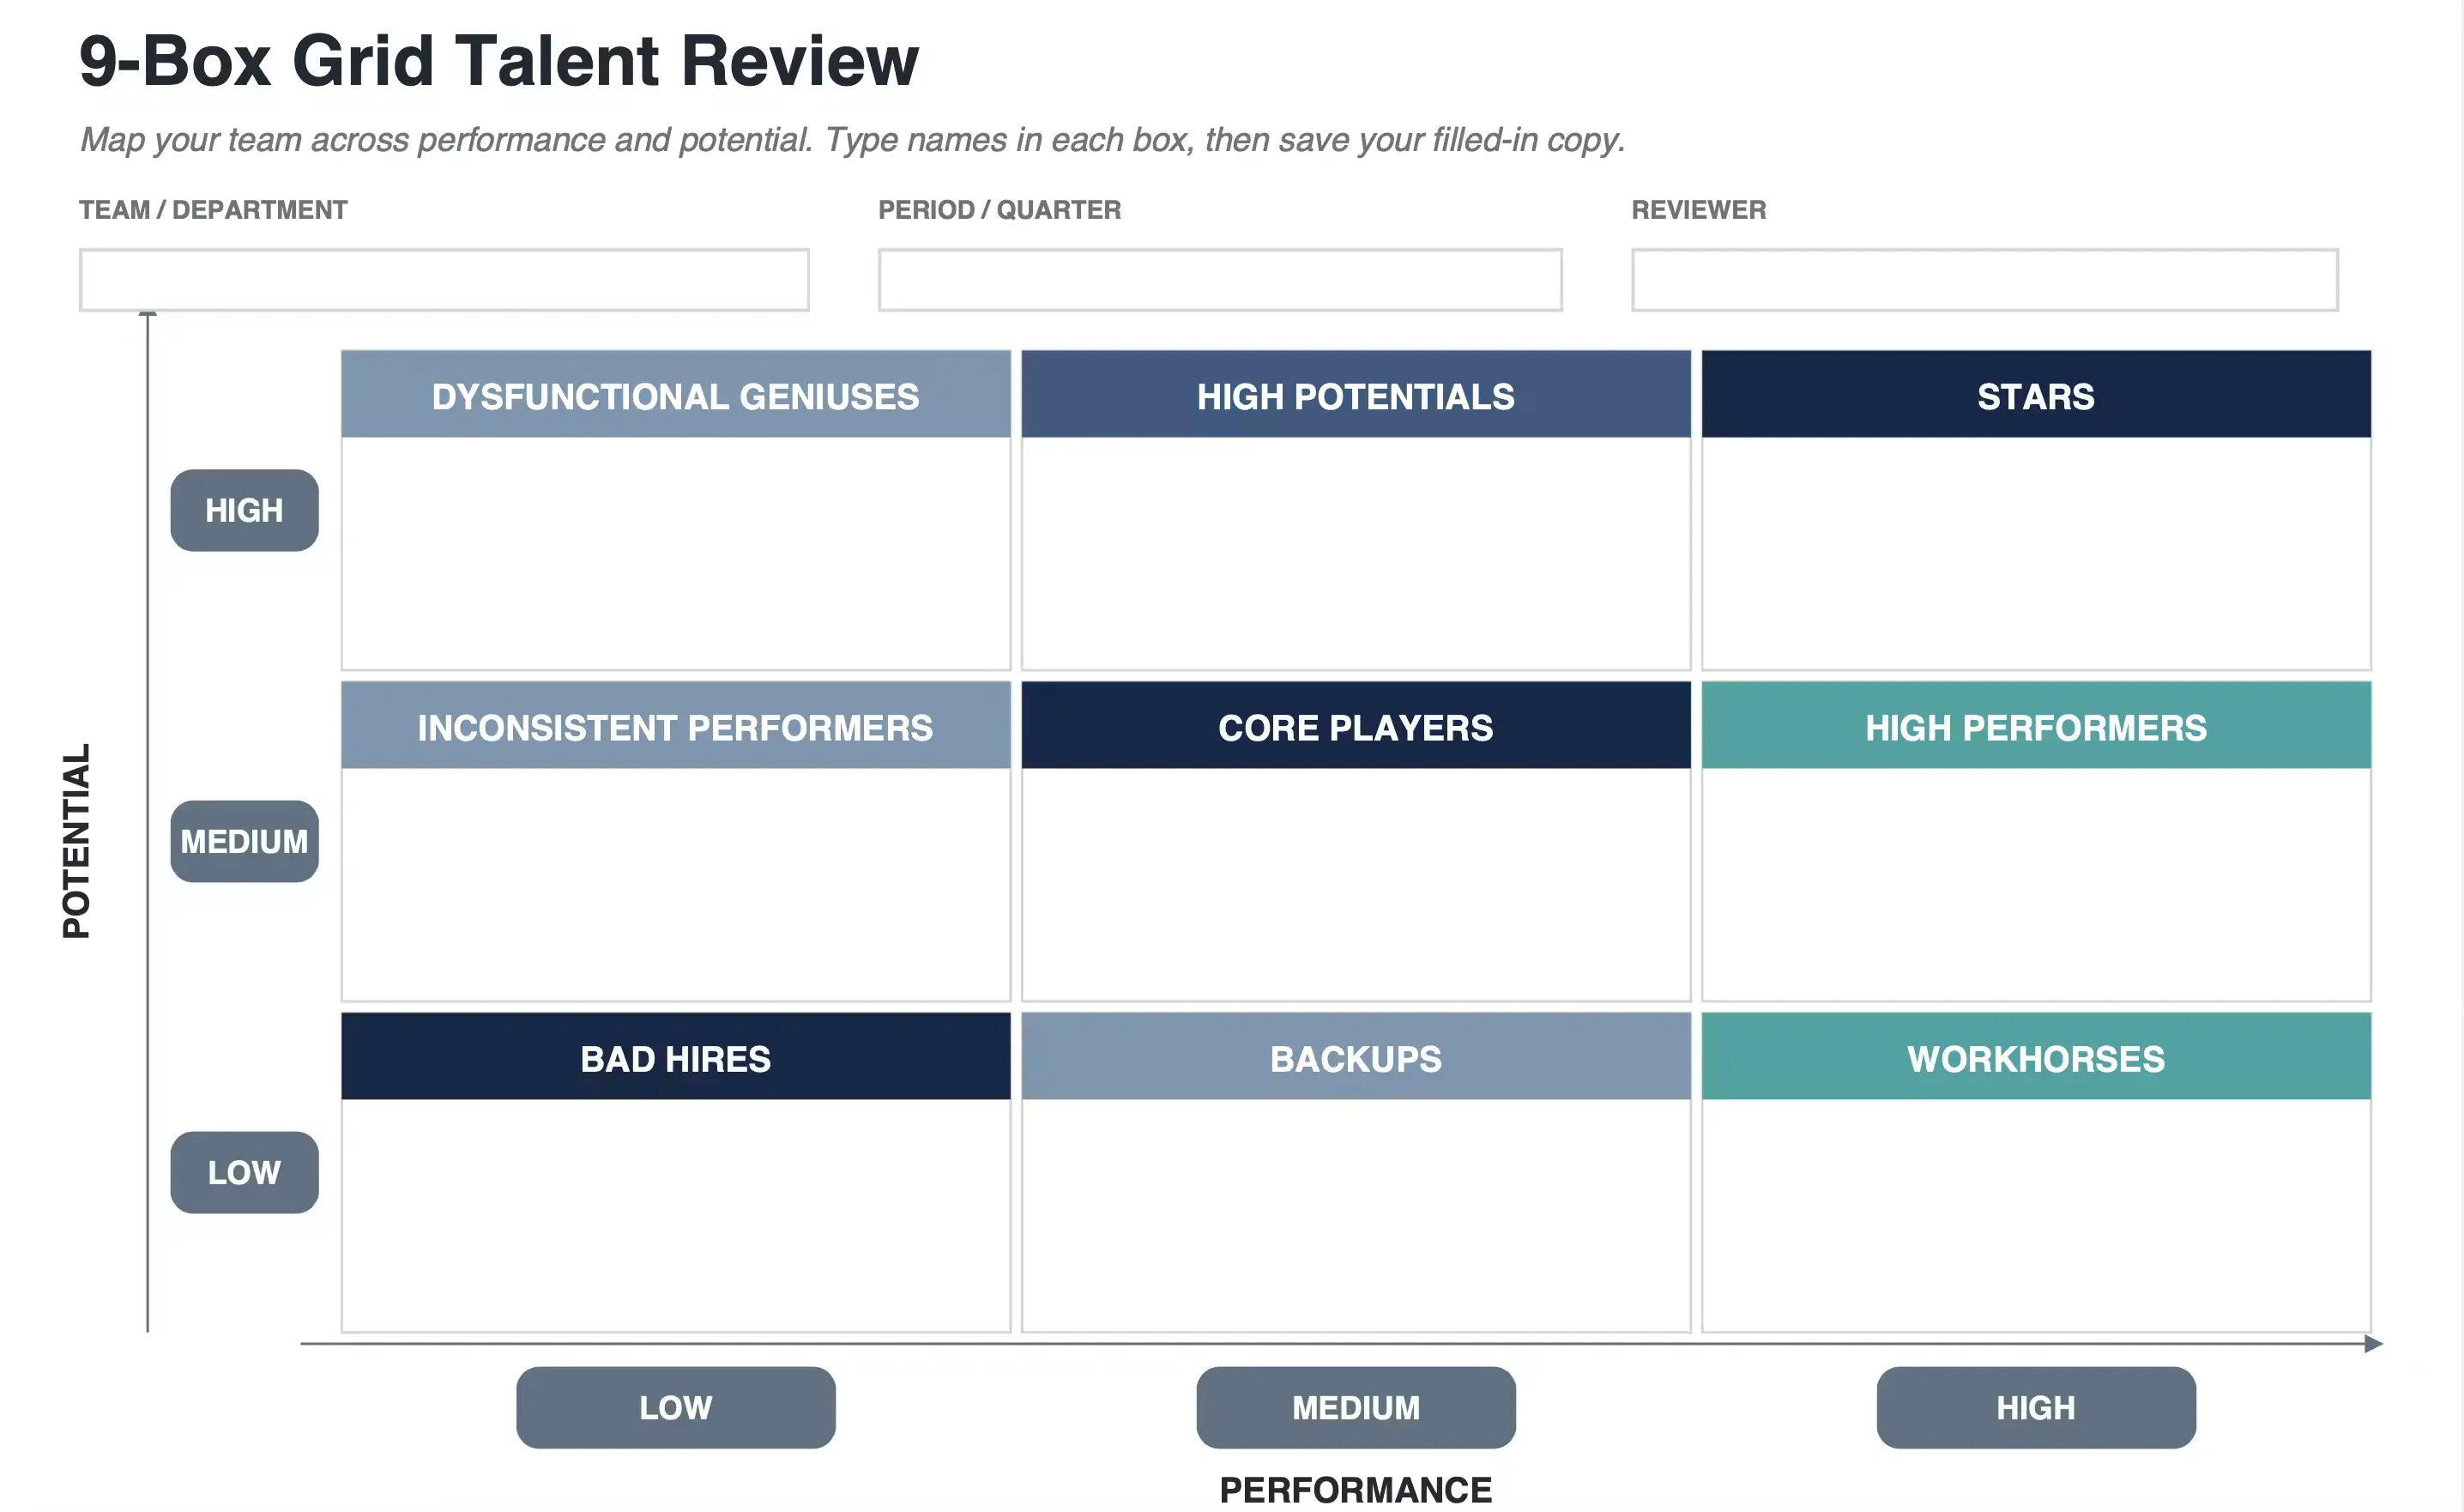
Best for: Teams who want a single-page 9-box assessment form they can fill on screen, share over email, or print and complete by hand.
What's inside: one page, no numeric scale since names are typed directly into each box, 13 fillable fields including a notes section for flagging a ready-now successor, and room for as many names as fit in each box by hand.
Key features
Why choose this template: The format removes the software dependency. There is no Excel, no PowerPoint, no Google Workspace login. Fill the form on screen and save your copy, or print a blank sheet for an in-person calibration session and transcribe later. The same file works for digital and offline reviews, which makes it the right fit for off-site sessions and any team that prefers pen and paper.
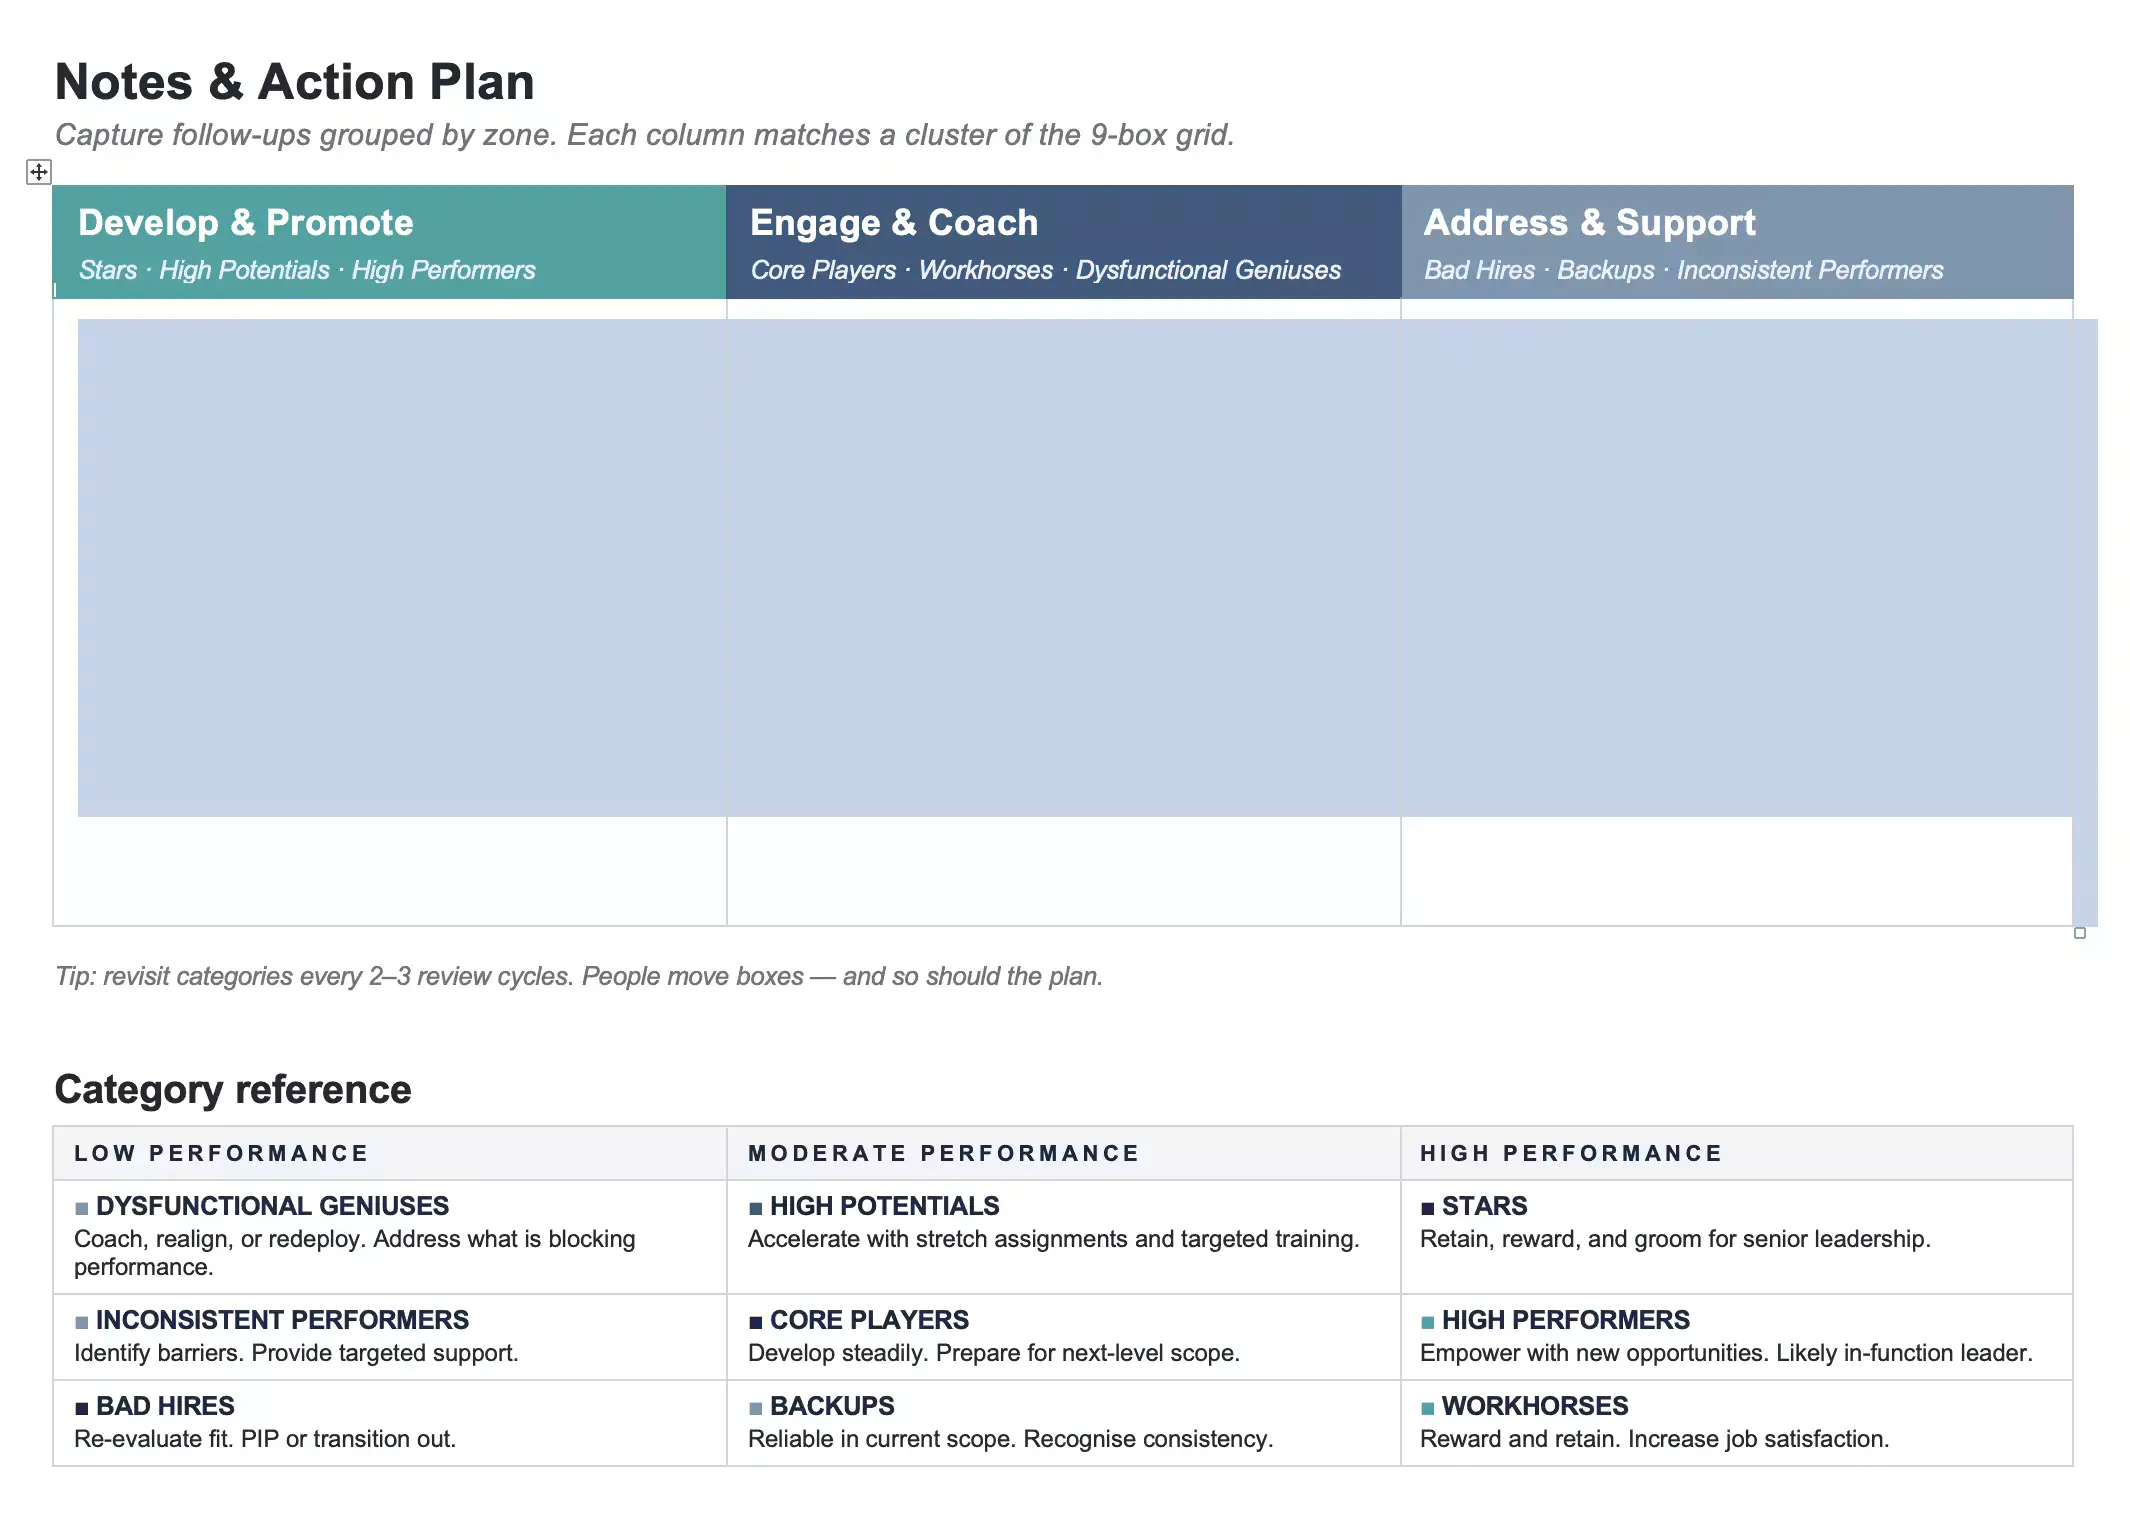
Best for: Teams who want to embed the 9-box matrix inside a larger HR document, share an editable draft over email, or use Word as their main writing surface for talent reviews.
What's inside: two pages, a category reference table instead of a numeric scale, a Notes and Action Plan section grouped by zone with space to name a development plan owner for each, and blank cells sized for typing names directly.
Key features
Why choose this template: Word is where most HR documentation already lives. Calibration notes, succession plans, manager guides, employee development paths. Dropping the talent mapping grid into the same format means it can sit alongside the rest of the documentation rather than as a separate file. The blank cells type cleanly, and the document prints well if anyone needs a hard copy.
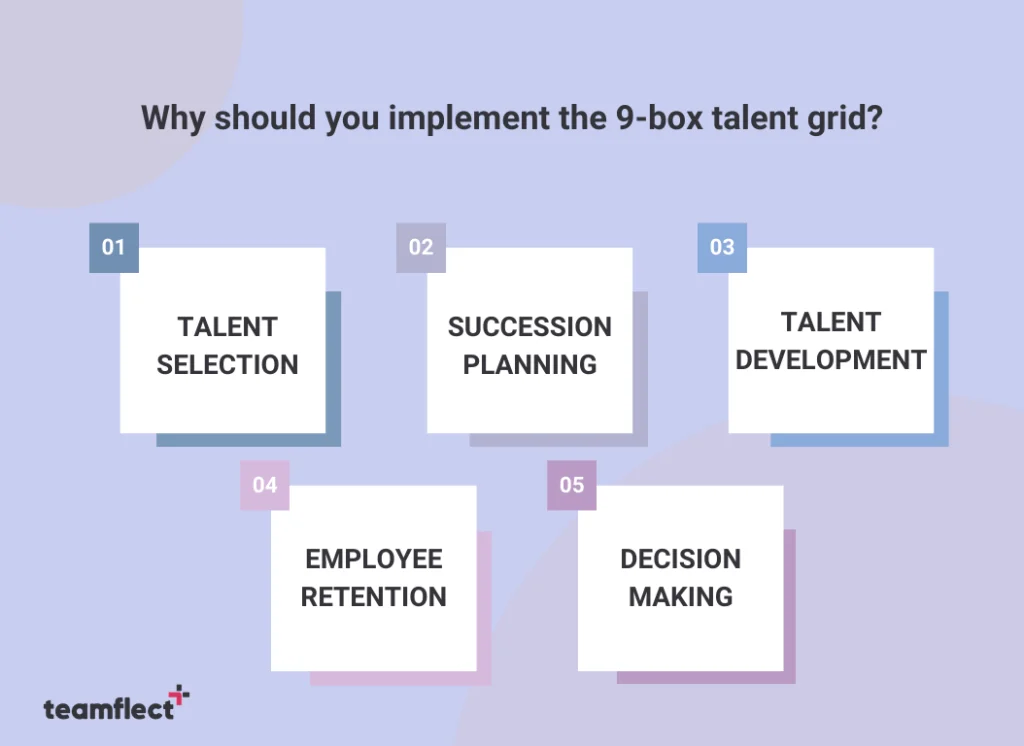
We've established a clear understanding of what the 9-box grid is. Now let's see how 9-box grid succession planning actually works, especially if you want to run it through 9-box succession planning software instead of a spreadsheet.
It is essential to involve multiple stakeholders in the evaluation process when using the 9-Box Grid for Succession Planning. Taking into account different perspectives and experiences will help ensure that the results are as accurate as possible.
A well-rounded view of an employee’s performance and potential can be provided by managers, HR professionals, and other key decision-makers.
Once the evaluation process is complete, a business can use the results of the 9-Box Grid to make educated decisions about personnel management and development. They can identify critical roles and workers who are prepared to take the lead, as well as those who need additional support to realize their full potential.
Organizations can then use this data to create a personalized growth plan and pinpoint any possible difficulties with succession planning.
The nine boxes are numbered from the bottom-left cell to the top-right cell, so Box 1 is low performance with low potential and Box 9 is high performance with high potential.
Most teams score each axis 1 to 3, which maps one score directly to one row or column. A 1 to 5 scale gives finer ratings but needs a rule for what happens to a 2 or a 4, so decide that rule before the first calibration meeting, not during it.
Whichever scale you pick, keep it consistent with the one already used in your employee performance scorecard.
The 9-box talent grid is an incredible tool for effective performance management and succession planning. The results from the 9-box talent grid can help organizations map out their talent effectively.
In order to use the 9-box talent grid effectively, leaders need to understand what each slot on the 9-box talent management matrix stands for. So now, we will explore what an employee’s position on the 9-box employee assessment needs and what a leader can do to improve that employee’s standing.
Most 9-box reviews fall apart in the same place. Two managers sit down to rate the same employee and they are working from two different definitions. One reads "potential" as long-tenure loyalty. Another reads it as cultural fit. A third reads it as "I think they could be a director someday." The grid ends up reflecting reviewer differences more than employee differences.
Get the two definitions on paper before the calibration meeting starts. A defensible version of each is below.
Performance looks backward. It rates the last 12 to 18 months, not the last quarter. Anchor on observable signals:
The simplest correction to most performance ratings is documentation. Asking managers' to log specific examples month by month produces a more honest 12-month picture than reconstructing it from memory at year-end.
Potential is the contested half, and it is where most calibrations stall. The most rigorously researched answer comes from Korn Ferry, whose decades of work point to one trait above all others: learning agility, the willingness and ability to learn from experience and apply that learning to new, unfamiliar situations.
The data is striking. According to Korn Ferry's research, executives with high learning agility are 18 times more likely to be identified as having high potential than peers with low learning agility, and they are promoted roughly twice as fast. Korn Ferry has gone as far as to argue that learning agility is a stronger predictor of leadership success than IQ, emotional intelligence, or formal education.
Twelve questions, six per axis, are enough to place someone defensibly: each one is answered on the same 1 to 3 scale, and the two totals give the row and the column.
Six questions for performance:
Six questions for potential:
Score every person against all twelve questions before anyone is placed on the grid. Placing first and justifying afterwards is what turns a calibration meeting into a negotiation.
Running these questions against a locked set of performance review templates keeps the scoring consistent instead of improvised meeting to meeting.
A first pass through all twelve, done as a 45-minute 9-box calibration meeting, is enough to get every name placed with reasons attached.
Note: If these fields sit under different names in Teamflect's own 9-box assessment form, the names used in the form take precedence over these questions, in which case the question wording is written to match the form.
The biggest risk with the 9-box grid is not that it sorts people. It is that the sort encodes bias and then gives that bias a structured, official-looking output. A scribbled rating in a manager's notebook can be argued with. A shaded cell in a calibrated matrix is much harder to challenge six months later.
Bohnet's argument in the Harvard Business Review article "Designing a Bias Free-Organization" is that organizations should redesign their processes to prevent biased choices, rather than trying to eradicate biases through awareness training. Her framing is the right one for the 9-box. The 9-box talent grid is one of those processes that has to be designed in a specific way to avoid biases.
Patterns across 11,000 performance reviews show the same four cognitive biases account for most of the noise in a typical calibration meeting:
Four cognitive biases account for most of the noise in a typical calibration meeting:
The potential axis is the most exposed to these distortions, because performance has at least some objective anchors and potential often has none.
These are structural fixes, not awareness exercises.
To best make use of the 9-box grid method, make sure to implement the following in your strategy:
When implemented well, these strategies with the 9-box grid will help your workforce grow, engage them and retain top talent within your organization.

.svg)
.avif)
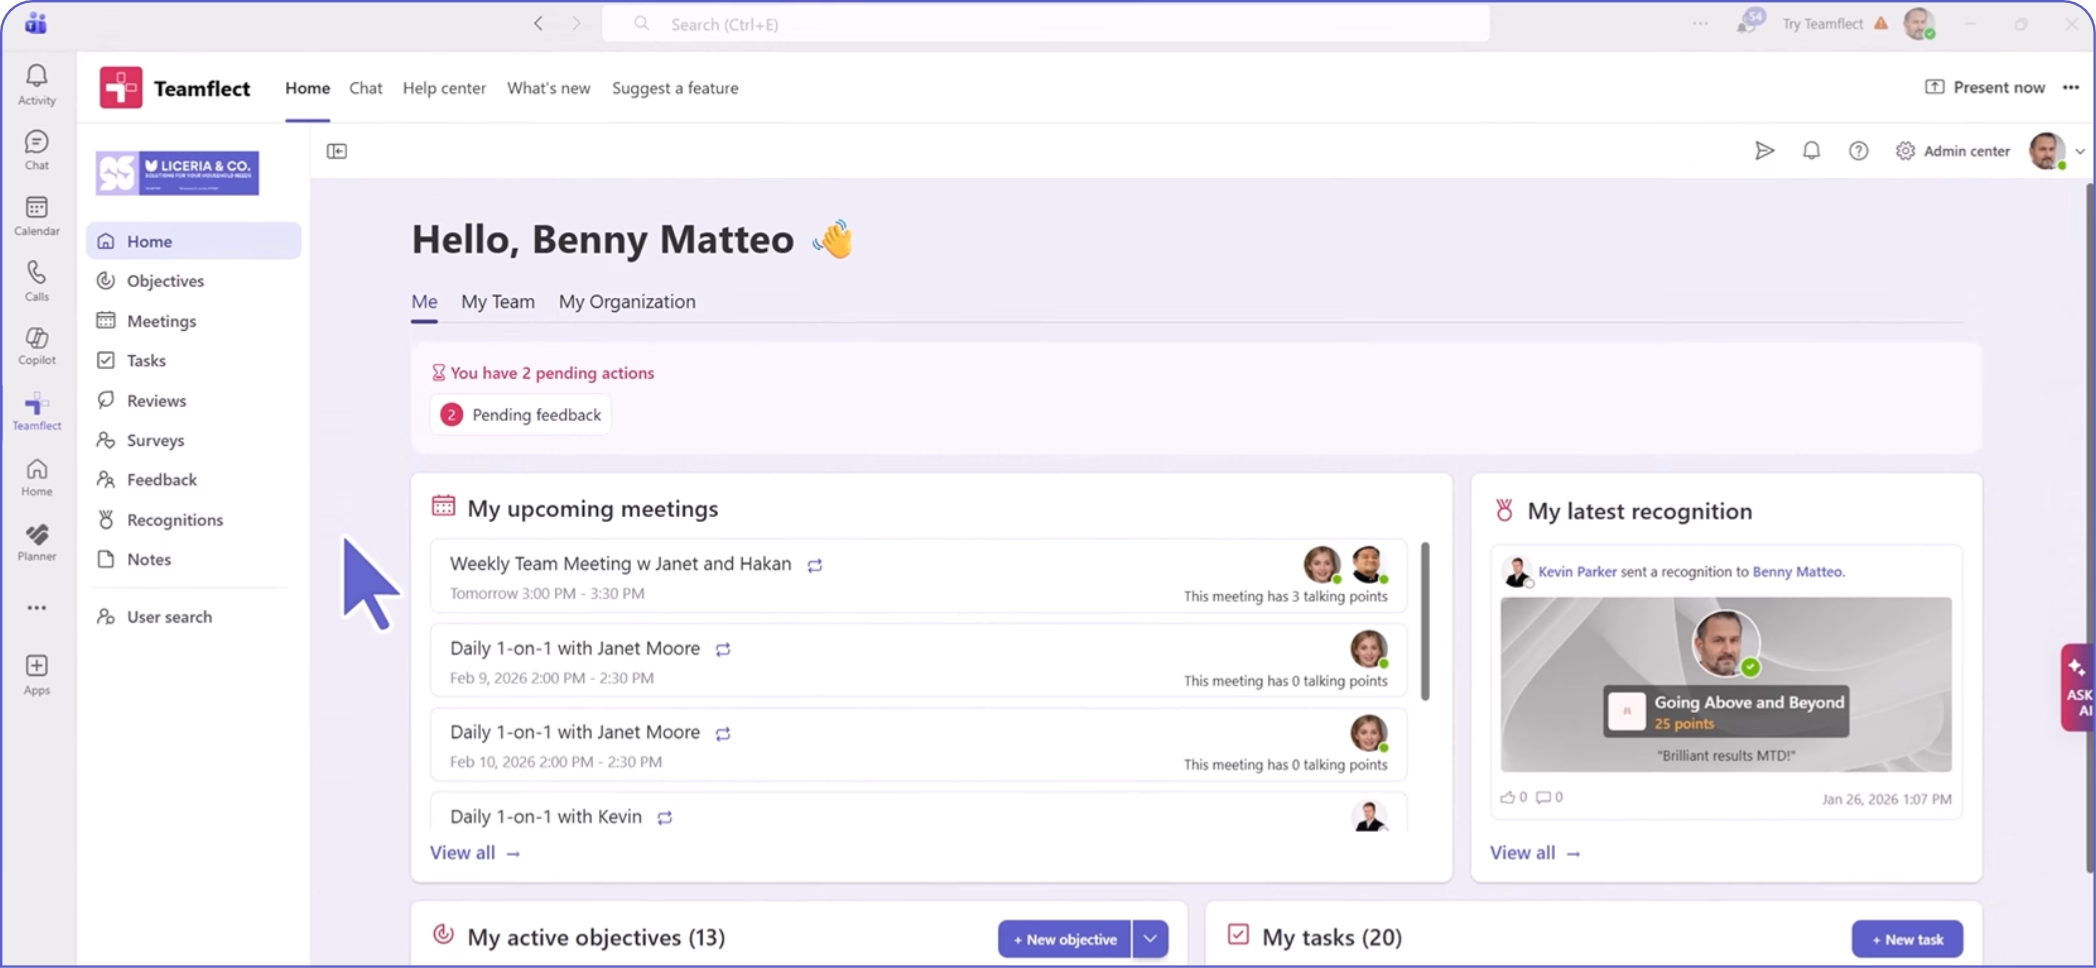
Create high-performing and engaged teams - even when people are remote - with our easy-to-use toolkit built for Microsoft Teams


.webp)
