Unlock Insights with Advanced HR Analytics


.avif)

.webp)


"I am a data person. I love the fact that I can send out multiple reviews, goals, surveys, and see all the data in one spot. I can easily see what’s completed, what’s not, and what should be done."
Kathleen Carper, Human Resources Coordinator, Confluence
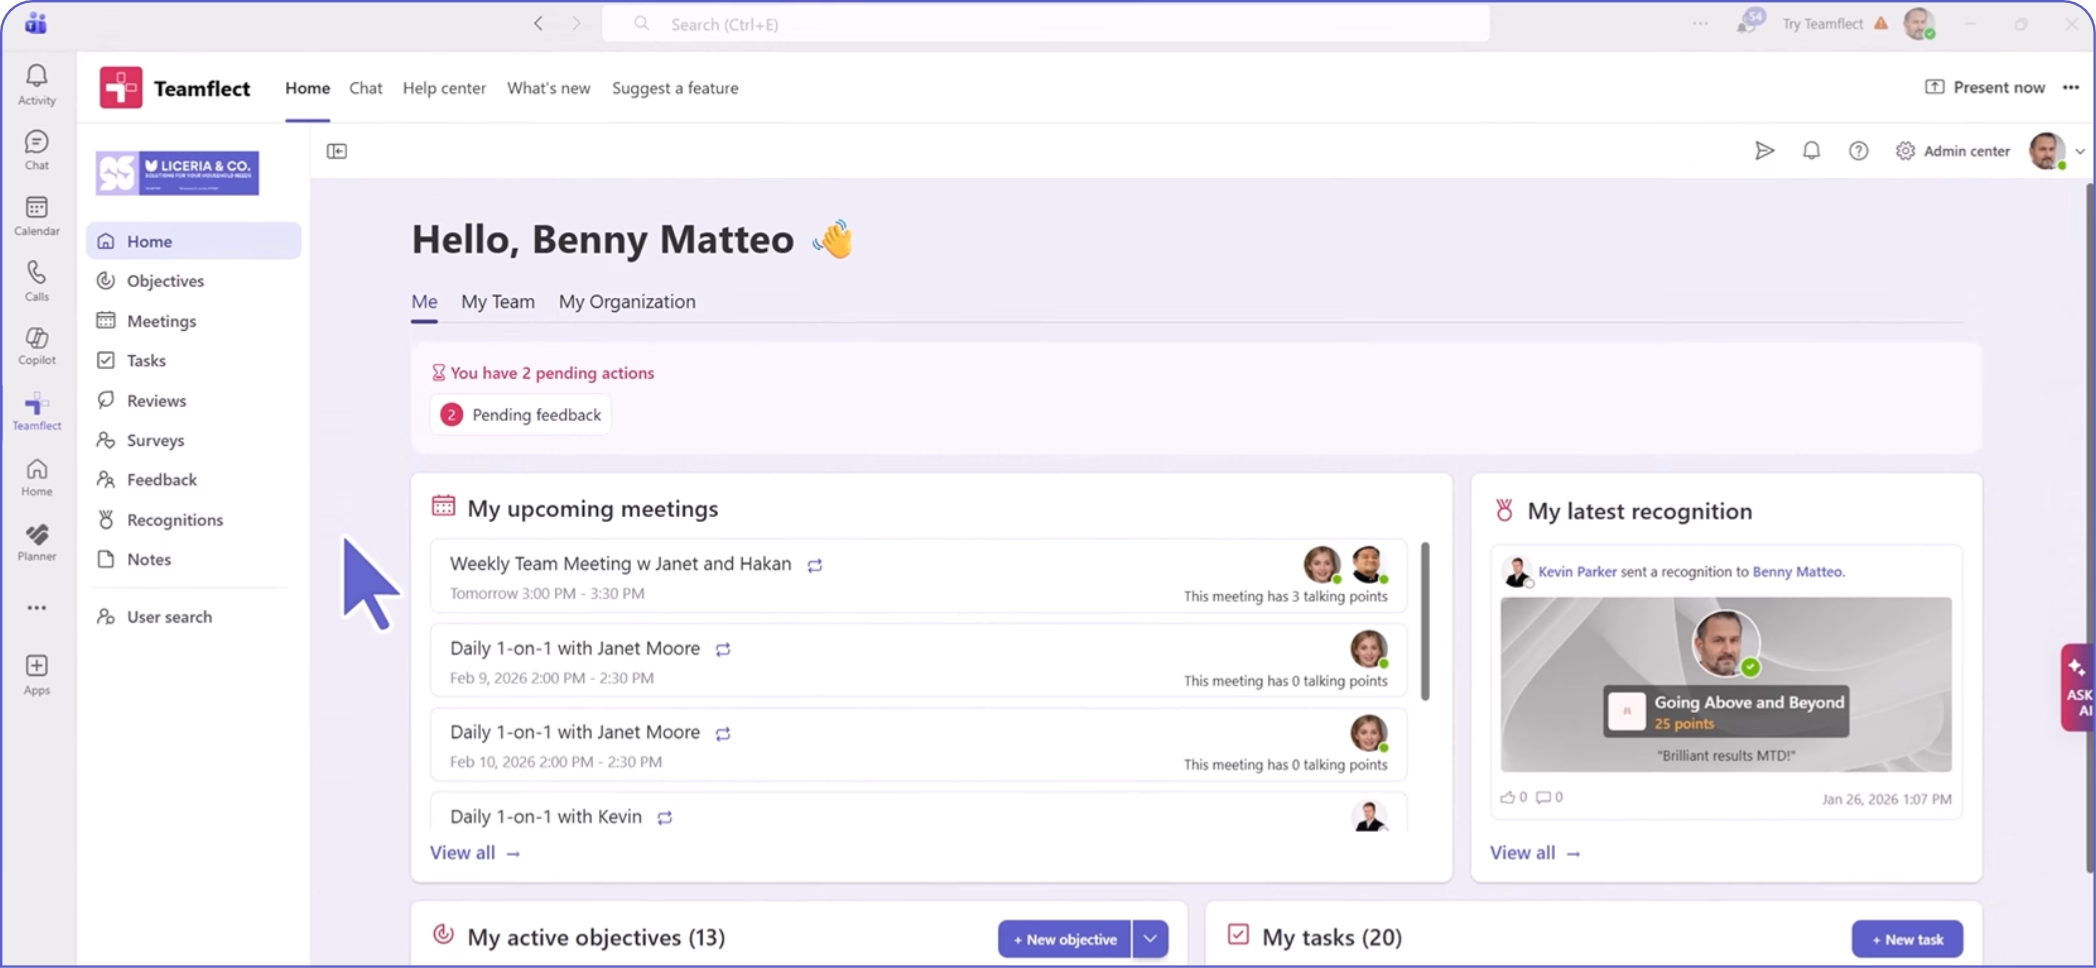
Create high-performing and engaged teams - even when people are remote - with our easy-to-use toolkit built for Microsoft Teams
Yes, HR analytics can be surfaced in Microsoft Teams either through an embedded Power BI report or through an HR app that reports natively inside Teams. Getting reports in front of managers where they already work is what makes them get looked at. Teamflect reports performance and engagement analytics through Power BI and inside Microsoft Teams, so managers see their own team's data without opening a BI portal.
Start with five: voluntary turnover, engagement score trend, goal completion rate, review completion rate, and internal promotion rate. Anything beyond that is usually reported because it is easy to measure rather than because it changes a decision. Teamflect covers the performance side of that list directly - goal completion, review completion, feedback volume and engagement scores - and reports them in Power BI alongside data drawn from your HRIS.
A dashboard leadership uses answers three questions on one screen: is engagement moving, are goals being hit, and where is turnover concentrated. Dashboards fail by showing twenty metrics with no comparison period rather than four with a trend line. Teamflect's Power BI reports are built around period-over-period and team-over-team comparison, so the board view shows movement rather than a snapshot.
You connect them by keeping performance, goals, feedback and engagement in one system, then reporting across them - which is difficult when each lives in a different tool with a different employee ID. This is the practical reason most HR dashboards stop at headcount and turnover. Teamflect holds reviews, goals, feedback, recognition and surveys in one platform and reports across all of them in Power BI, so an engagement dip can be read against goal completion for the same team and period.
Yes, and it has to: headcount, turnover, hiring and compensation live in your HRIS, while performance and engagement data usually live elsewhere. A useful HR dashboard combines both rather than reporting one half. Teamflect connects to 200+ HRIS systems including Workday, UKG, ADP and BambooHR for employee, manager and department data, and reports its performance and engagement data alongside it in Power BI.
Retention risk shows up as a pattern across several signals rather than in a single metric: falling engagement scores, stalled goals, fewer recognitions received and less frequent 1-on-1s. No tool can predict a resignation, but the combination flags where to have a conversation. Teamflect's AI Agent analyses feedback patterns, goal progress and interaction frequency to surface early warning signs, and reports them alongside engagement data in Power BI.
Yes, most modern HR analytics tools ship prebuilt dashboards precisely so HR teams do not need an analyst, and the ones aimed at mid-market companies are explicitly self-serve. The limiting factor is usually data quality rather than dashboard capability. Teamflect reports performance, goal, feedback, recognition and engagement data through Power BI dashboards that are ready out of the box, with no query writing required.
Power BI is Microsoft's reporting layer, so HR tools built on it inherit filtering, drill-down and sharing without a separate BI licence conversation for most Microsoft 365 customers. The advantage over a vendor's own charts is that the same report can sit next to finance and operations data. Teamflect delivers its performance, engagement and recognition reporting through Power BI, so HR reports live in the same environment as the rest of the business.
You track it by running short pulse surveys on a fixed cadence so the same questions are asked repeatedly and the score becomes comparable. An annual survey gives you a number with nothing to compare it to. Teamflect automates recurring pulse and engagement surveys inside Microsoft Teams and charts the trend in Power BI, so movement is visible quarter by quarter.
Department comparison requires the same metric definition across teams and a consistent time period, which is where most manual HR reporting breaks down. The headcount and turnover figures themselves come from your HRIS; the engagement and performance context that explains them does not. Teamflect reports engagement scores, goal completion and review outcomes by team and department in Power BI, so a high-turnover department can be read against its performance and engagement data.