Effective OKR (Objectives and Key Results) reporting is more than just tracking progress; it's about fostering alignment and transparency across all levels of an organization.
A recent study by OKR International revealed that 97% of respondents believe the right organizational culture is crucial for OKR success, emphasizing the importance of clear communication and shared understanding among stakeholders.
This approach not only keeps teams focused but also ensures that everyone, from executives to individual contributors, is aligned with the organization's strategic objectives.
In this blog, we'll explore how to craft OKR reports that do more than just update progress toward goals; they'll serve as tools for alignment, accountability, and informed decision-making to achieve company goals.
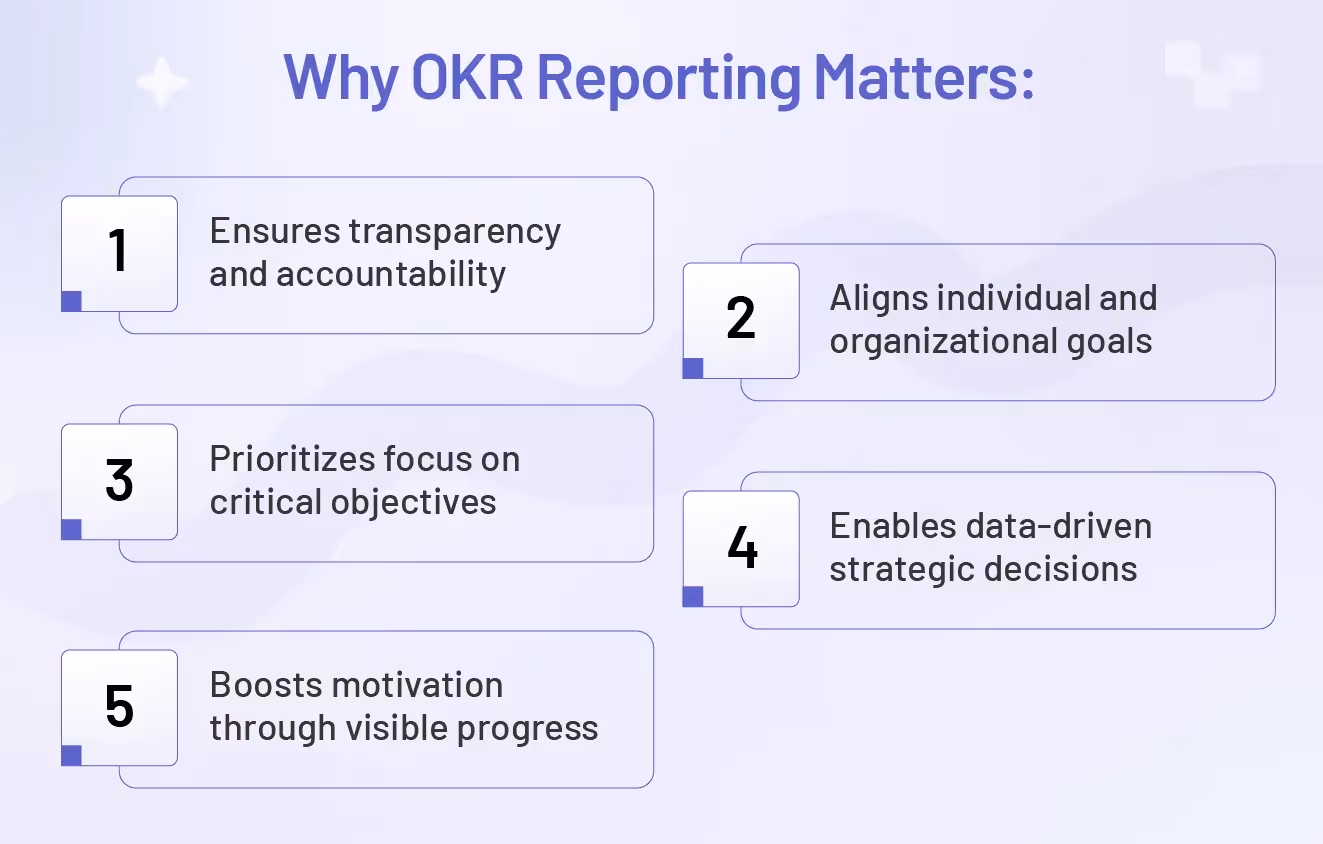
5 Compelling Reasons to Prioritize OKR Reporting in 2026
In the fast-paced business landscape of 2026, OKR reporting has evolved from a simple status update into a vital strategic asset. Organizations that master the art of reporting don't just track numbers; they build a culture of high performance and radical transparency.
According to research published by Harvard Business Review, companies that successfully align their daily activities with a clear organizational vision are more than twice as likely to be top performers. By refining your approach to OKR reporting, your team can unlock several critical advantages:
Eliminate Blind Spots: Turn abstract goals into visible progress bars, ensuring no objective falls through the cracks.
Bridge the Strategy-Execution Gap: Connect daily tasks directly to high-level company vision, giving every employee a sense of purpose.
Accelerate Pivot Speed: Identify lagging Key Results early, allowing leadership to reallocate resources before a minor delay becomes a major failure.
Boost Psychological Safety: Create a "no-surprises" environment where blockers are surfaced and solved collaboratively rather than hidden.
Standardize Success: Establish a universal language for "what good looks like" across different departments, from Engineering to HR.
What is OKR Reporting?
OKR reporting is the ongoing process of monitoring, measuring, and evaluating progress toward achieving Objectives and Key Results (OKRs) within an organization. It involves checking in regularly on how well teams or individuals are moving toward their set objectives by tracking specific, measurable key results (KRs) throughout the OKR cycle. This continuous monitoring helps ensure alignment, engagement, and timely adjustments to stay on track with goals. Adopting a shift to continuous performance management supports ongoing alignment and agility.
Key Elements of OKR Reporting:
Set Clear Objectives - teams define ambitious, qualitative goals that clarify what they want to achieve.
Define Measurable Key Results - for each objective, teams create specific, quantifiable outcomes that indicate progress. Key Results turn goals into trackable targets.
Assign Ownership - individuals or teams take responsibility for specific OKRs to ensure clear accountability and execution.
Conduct Regular Check-ins - weekly or bi-weekly check-ins help teams monitor progress, discuss blockers, and realign as needed. These meetings keep OKRs active and relevant.
Track Progress with Scoring - teams update the status of each Key Result using a standardized scoring system to show how close they are to completion.
Ensure Visibility - OKRs are kept visible—via dashboards, tracking tools, or shared documents—so progress is transparent and alignment across teams is maintained.
Scoring & Reflection – periodic evaluations are done to measure progress and guide end-of-cycle reflection.
Reflect and Adjust - throughout the cycle, and especially at the end, teams review what worked, what didn’t, and make adjustments to strategies or OKRs for the next cycle.
Why is OKR Reporting Essential for Stakeholder Alignment?
Team and stakeholder alignment requires OKR reporting as its foundation. The transparency and trust that it provides ensure that members understand their individual contributions to an organization’s broader objectives.
Effective reporting delivers key benefits likegoal alignment. According to the 2023 OKRs State of the Industry Report by OKR International, organizations that implement OKRs effectively experience significantly better strategic performance compared to those in earlier stages of adoption.
Effective reporting delivers several key benefits:
Transparency and Accountability: Regular check-ins make progress visible, fostering trust and holding teams accountable.
Strategic Alignment: Cascading OKRs from company-wide objectives to individual tasks ensures unified direction.
Focus and Prioritization: Reporting highlights critical goals, reducing distractions from low-value tasks.
Motivation and Engagement: Seeing how their work impacts larger goals boosts employee morale, with a 2024 Atlassian study noting that teams prioritizing OKRs are 4.6x more likely to be productive and improve customer satisfaction.
What Information Should Be Included in an Effective OKR Reporting Process?
Effective OKR reports thrive in that elusive balance between clarity and detail. This provides stakeholders with the necessary information without the overload. This information includes:
Component
Description
Objectives
Qualitative, inspiring goals that outline what the team aims to achieve.
Key Results
Specific, measurable outcomes that track progress towards objectives.
Progress Summary
Current status of key results, often with percentages or visual indicators.
Blockers
Obstacles or challenges hindering OKR progress.
Action Plans
Steps to address blockers and achieve measurable key results.
Avoid including non-essential details, such as unrelated metrics or excessive technical jargon, which can overwhelm stakeholders. Instead, focus on data that drives decision-making and aligns with company goals.
How Frequently Should You Conduct OKR Reporting to Keep Stakeholders Informed?
The frequency of OKR reporting depends on organizational size, OKR cycle length, and stakeholder needs. Common cadences include:
Cadence
Best For
Pros
Cons
Weekly
Fast-moving projects, small teams
Quick feedback, high agility
Time-intensive, may feel repetitive
Bi-weekly
Medium-sized teams, balanced oversight
Balanced frequency, actionable updates
Less frequent feedback
Monthly
Larger organizations, long-term projects
Comprehensive updates, less frequent
Risk of delayed course correction
Quarterly
End-of-cycle reviews, strategic alignment
In-depth analysis, strategic focus
Limited real-time insights
To maintain consistency, establish a clear schedule and communicate expectations to stakeholders. For example, weekly check-ins work well for high-priority initiatives, while quarterly reviews suit high level evaluations.
What Are the Best Tools and Platforms for OKR Reporting?
Tracking tools, visualization tools, and collaborative software all provide support in coming up with effective OKR reporting. Each of them offers unique strengths that can answer specific organizational needs. Some examples are:
Tool
Key Features
Best For
Pricing (July 2025)
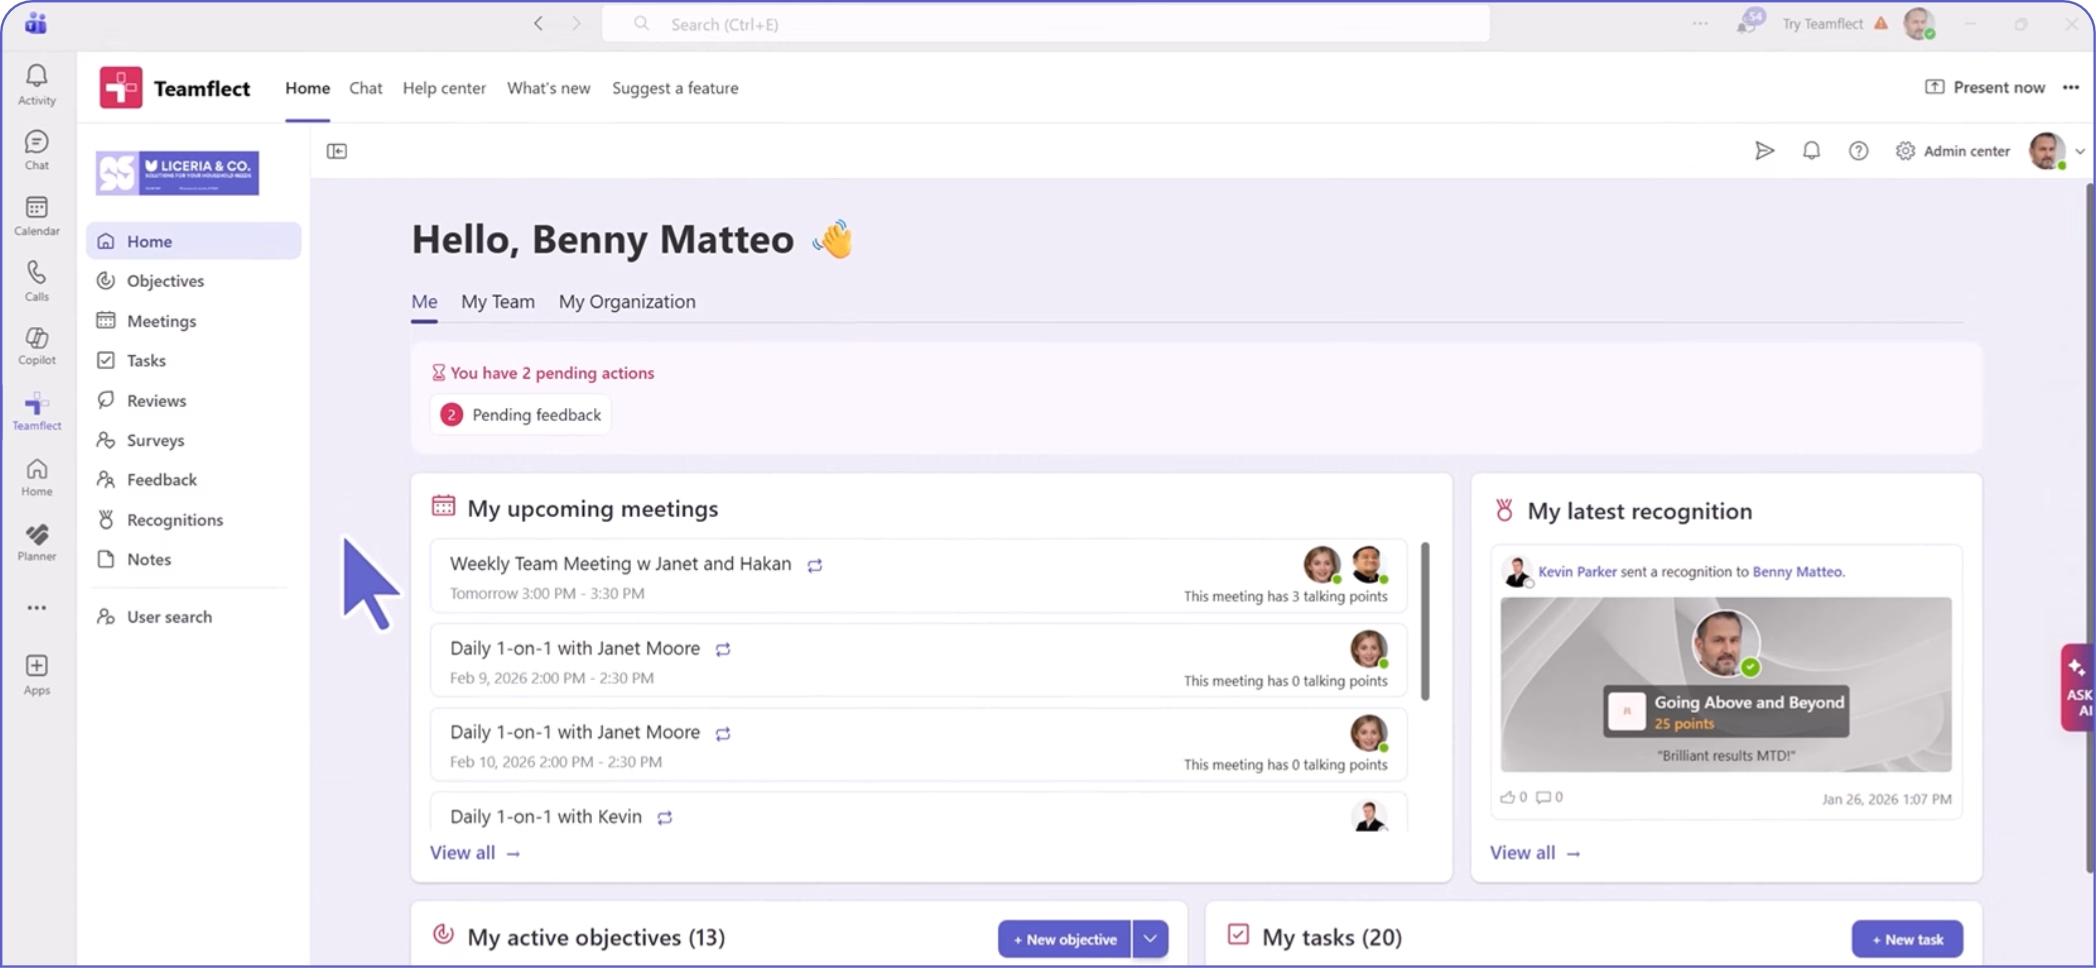
Teamflect
MS Teams integration, OKRs, 1:1s, feedback
Microsoft-based organizations
Free (up to 10 users); Paid: Essential: $7/user/year, Professional: $11/user/month
$11/user/month (Performance+OKRs); Add-ons: +$4 each
Profit.co
OKRs, alignment tools
Scalable teams
$8/user/month
If your organization uses Microsoft Teams or Outlook for communication and collaboration, then there is only one true choice:
Highest-Rated OKR Tracking Software for Microsoft 365
If your organization runs on Microsoft 365, Teamflect is the highest-rated OKR software in the Microsoft Teams App Store. Fully integrated with Microsoft Teams, Teamflect helps managers and teams stay aligned, accountable, and connected - without ever leaving their existing workflow.
Teamflect makes it easy to set and track goals inside Microsoft Teams channels and chats, helping organizations boost OKR adoption without disrupting daily operations. Save time and streamline your workflow with features designed specifically for Microsoft 365 environments:
Key OKR Features in Teamflect:
Stay inside Microsoft Teams and Outlook to manage your goals, no need to switch platforms.
Use your existing org chart in Microsoft Teams to control OKR ownership and permissions.
Access built-in training and implementation support to get your team up and running quickly.
How Do You Choose the Right OKR Reporting Tool for Your Organization?
Selecting the right tool requires evaluating:
Team Size: Small teams may prefer simple tools like Weekdone, while enterprises need scalable solutions like Lattice.
Integration Needs: Ensure compatibility with tools like Slack or Microsoft Teams.
Data Visualization: Prioritize tools with clear dashboards for stakeholder accessibility.
Pricing: Balance cost with features, especially for startups with tight budgets.
User-Friendliness: Choose intuitive platforms to minimize training time.
The right OKR software can bring all these factors together, helping your organization find the best starting point for its OKR reporting journey.
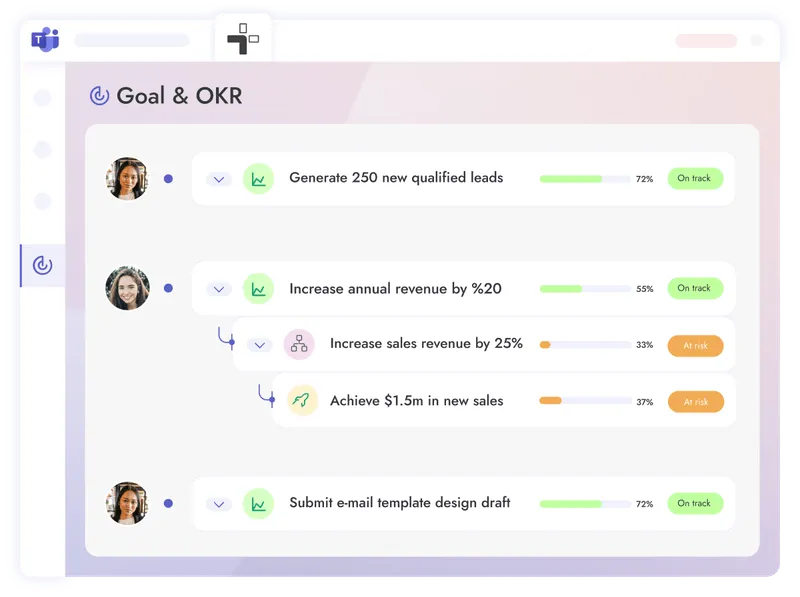
How Can Visual Dashboards Improve OKR Reporting Effectiveness?
Visual dashboards transform complex OKR data into digestible insights. Key features include:
Progress Bars: Show real-time progress (e.g., 75% completion for a key result).
Charts and Graphs: Illustrate trends, such as monthly growth in key metrics.
Heatmaps: Highlight OKRs that are on track (green) or at risk (red).
For example, a dashboard might display a bar chart showing a 20% increase in website traffic for a marketing OKR, with a heatmap flagging a delayed key result. Consider data visualization tools for enhancing your report with visuals.
What Are the Common Mistakes in OKR Reporting to Stakeholders, and How Can You Avoid Them?
Even well-intentioned OKR reporting can fail. For a deeper understanding, explore common performance management mistakes to avoid.
Here are some common pitfalls to look out for and suggested solutions to get through them:
Mistake
Description
Solution
Data Overload
Overwhelming stakeholders with excessive data
Focus on key metrics and trends
Vague Key Results
Using unclear or unmeasurable outcomes
Ensure results are SMART (Specific, Measurable, Achievable, Relevant, Time-bound)
Lack of Context
Presenting data without explaining its impact
Provide narrative explanations
Inconsistent Reporting
Irregular updates disrupting trust
Stick to a fixed cadence
How Do You Tailor OKR Reporting for Different Stakeholder Groups?
OKR reporting becomes more effective when customized for the specific interests, roles, and information needs of each stakeholder group. Below are the main strategies to ensure OKR reporting is relevant and actionable for diverse audiences.
1. Identify Stakeholder Groups and Their Needs
Common stakeholder groups include:
Executives & Senior Management: Interested in overall business impact, high-level progress, strategic alignment, and risk.
Middle Management: Focused on departmental outcomes, resource allocation, barriers, and cross-team alignment.
Team Leads & Individual Contributors: Need detail on team objectives, individual impact, and actionable next steps.
External Stakeholders (Partners, Clients): Care about delivery against promised outcomes, transparency, and trust.
Reporting format and frequency can greatly impact the effectiveness of communication. Depending on the audience and purpose of the report, it is important to adapt the format and frequency to suit their needs:
Executives: Monthly or quarterly, concise dashboards with charts and KPIs.
Managers: Bi-weekly or monthly, emphasizing department-level breakdowns.
Teams: Weekly, actionable check-ins and progress updates.
External Stakeholders: Aligned with project milestones or contractual periods; focused on deliverables and outcomes.
4. Highlight What Matters Most to Each Group
To effectively communicate with different stakeholders, it is important to understand what matters most to each group:
Executives: Focus on high-level metrics and overall organizational performance. Data should be concise and visually appealing to save time.
Managers: Look for department-specific data and used trends with frequent updates. This helps them make informed decisions and adjust strategies as needed.
Teams: Need regular progress updates with actionable insights. Reports should highlight roadblocks and areas to continuously improve.
External Stakeholders: Require custom reports tailored to their needs and interests. These should showcase organizational impact and demonstrate value to the customer.
5. Incorporate Stakeholder Feedback
Use regular surveys and feedback mechanisms to ensure reporting remains valuable.
Adjust KPIs, formats, and cadence based on direct input from each group.
The need for customized reports stems from the differences between groups of stakeholders. These aren't superficial preferences but real organizational needs that are diverse. There are many ways to approach OKR reporting for every department. For instance, an executive report might highlight company-wide OKR completion rates, while a team leader’s report details specific blockers like “Delayed software release.”
What Metrics Should You Track to Measure the Success of Your OKR Reporting?
Identifying key metrics allows for accurate evaluation of whether your OKR reporting is successful or not. Some of these key metrics are summarized below:
Metric
Description
Target
OKR Completion Rate
Percentage of OKRs achieved
70-80% per cycle
Reporting Participation
Stakeholder engagement with reports
90% view rate
Stakeholder Satisfaction
Feedback on report clarity and usefulness
85% positive feedback
Reporting Frequency Consistency
Adherence to scheduled reporting cadence
100% on-time delivery
Explore the use of performance tracking tools to monitor OKR completion rates to help achieve more success.
How Do You Collect Feedback on Your OKR Reporting Process?
Feedback drives continuous improvement in OKR reporting, as it does other metrics of success. While it is troublesome and awkward to empower people to give feedback, it serves as an important factor in any organization’s success. Effective methods include:
Surveys: Send quarterly surveys to gauge stakeholder satisfaction with report clarity and relevance.
Retrospectives: Hold post-cycle meetings to discuss what worked and what didn’t.
One-on-One Meetings: Gather direct feedback from key stakeholders during regular check-ins.
Final Thoughts
Like a mathematical equation, effective OKR reporting is the main factor for stakeholder alignment, transparency, focus, and organizational agility. The clarification of objectives, measurable key results, and actionable insights through reporting allows for team alignment and goal sustainability.
When done with the right frequency and tools, OKR reporting can drive any organization to success and possibly even exceed expectations. Learn more about measuring performance review effectiveness to optimize your evaluation strategies.
By setting OKRs that are ambitious and using a goal-setting framework to monitor progress, organizations can see better results, improve performance, and ensure the process aligns with the overall business strategy. Supporting these goals with well-structured individual development plans can help nurture employee growth alongside organizational objectives.
.svg)
.svg)

.svg)

.avif)
.svg)
.avif)

_UsersMostLikelyToRecommend_Enterprise_Nps%201.svg)

.svg)
.svg)


.svg)
.svg)
.webp)