.svg)
Performance Management Analytics: What to Measure and How to Visualize
.svg)
0
min. read

Updated on:
January 30, 2026
Prefer Teamflect as your HR source on Google
.svg)
In today’s competitive business environment, organizations are increasingly turning to employee performance tracking to optimize performance and align it with organizational objectives. Businesses can use data-driven insights to make better decisions, boost productivity, and improve overall performance.
From tracking key performance indicators to visualizing performance metrics, this data-driven approach surpasses traditional performance reviews by using data analytics to make informed decisions, boost business performance, and achieve success.
This comprehensive guide explores what performance management entails, why it’s critical, the metrics to track, and how to effectively visualize performance data to support continuous improvement.
Performance management analytics involves gathering, interpreting, and analyzing data to improve and conceptualize employee development.
Unlike conventional performance management process methods, analytics draws on objective sources such as human resource management systems (HRIS), productivity solutions, employee surveys, and feedback systems.
This approach provides a complete picture of performance trends, enabling organizations to identify trends, forecast future outcomes, and align individual and company performance with organizational goals.
The process typically involves:
For example, multiple international technology companies have increased their quality of employees hired significantly, leading to improved productivity and cost savings. (Source: SHRM)
Implementing performance management analytics isn't just about software; it’s about creating a sustainable loop of measurement and improvement. To move beyond basic tracking, you need a structured approach that ensures your data leads to actual behavior change across the organization. This strategic shift is vital considering that, according to Gartner, 82% of HR leaders say their organizations’ performance management processes are not effective at achieving their primary objective.
When refining your approach to performance management analytics, follow these essential steps to ensure success:
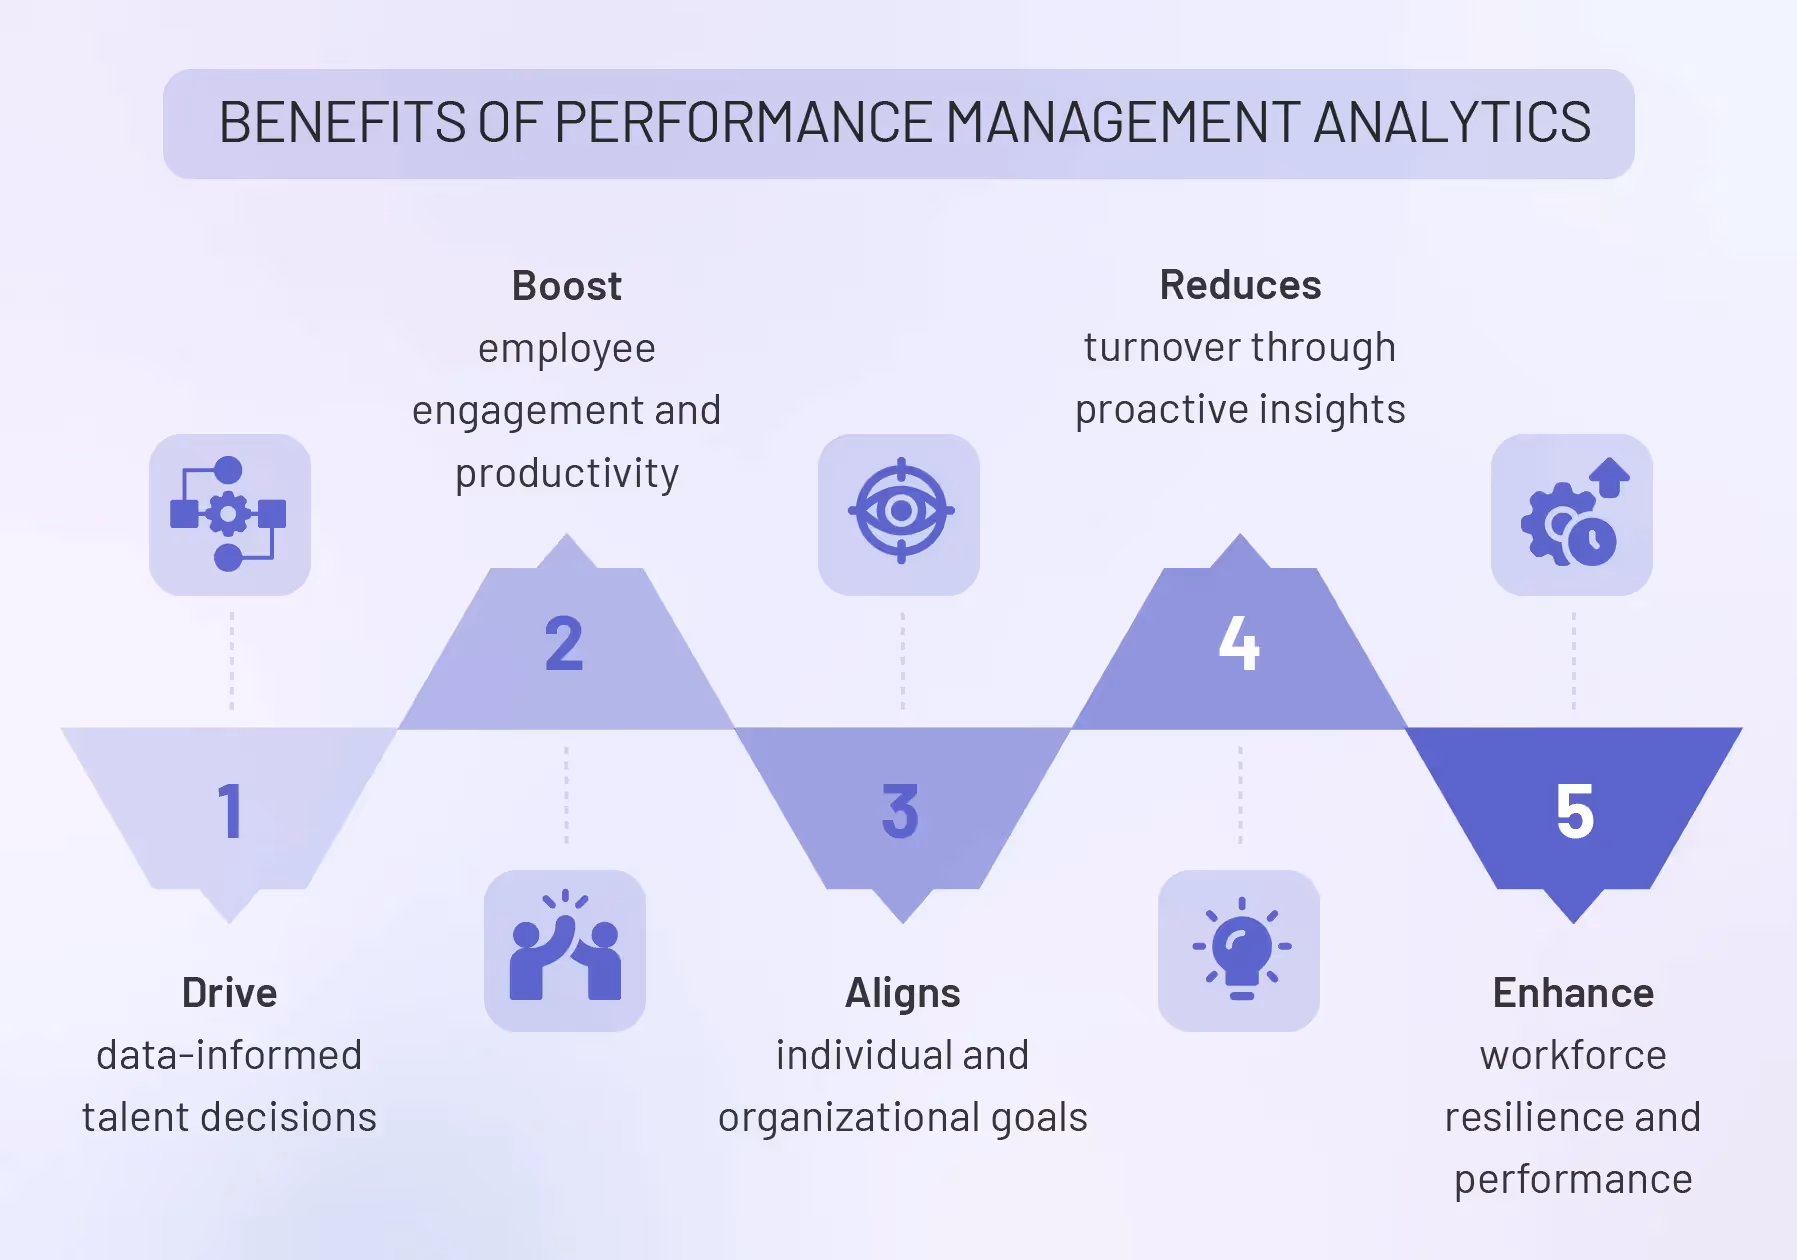
Performance management analytics is critical for organizations aiming to maximize their workforce and achieve business goals. Organizations may identify high performers, make well-informed decisions, and address subpar performance before it affects performance goals by utilizing the appropriate data.
The key benefits include:
Research supports these benefits. For instance, companies with engaged employees have 21% higher profitability and 17% higher productivity. Additionally, highly engaged business units experience a 41% reduction in absenteeism.
To gain a comprehensive understanding of employee performance, organizations should track a mix of quantitative and qualitative metrics. These key performance indicators KPIs provide insights into various aspects of performance, from goal achievement to leadership effectiveness. The following table summarizes the key metrics and their measurement methods:
Objectives and Key Results (OKRs) are a goal-setting framework where qualitative objectives define what the organization aims to achieve, and quantitative key results measure progress. Analytics plays a crucial role in tracking OKR progress by providing real-time data, enabling organizations to monitor performance and make adjustments as needed to meet clear goals.
Measuring employee productivity is essential for understanding workforce contributions to business goals. Productivity metrics vary by role and industry but commonly include output per hour, revenue per employee, task completion rates, and role-specific metrics like story points completed for software developers or sales closed for sales teams.
Employee engagement drives productivity, retention, and business success. Engagement scores, measured through surveys like Gallup’s Q12 or employee Net Promoter Score (eNPS), quantify how committed and motivated employees are. Feedback frequency, tracked through an employee review system, ensures employees receive regular, constructive input to improve performance.
Training enhances employee skills and performance, but its impact must be measured to ensure effectiveness. Key metrics include training completion rates, pre- and post-training assessments, skill application on the job, and return on investment (ROI). Analytics tracks these metrics to evaluate training success and guide improvements in development programs.
High employee turnover is costly, with replacement costs ranging from 50% to 200% of an employee’s annual salary. Analytics tracks turnover rates, identifies patterns through exit interviews and surveys, and predicts risks using prescriptive analytics. For instance, Gallup estimates that replacing leaders costs 200% of their salary, while frontline employees cost 40%. Reducing turnover through analytics saves costs and maintains workforce stability.
Managers significantly influence team performance and engagement. 360-degree reviews, a form of performance reviews, gather feedback from multiple sources to assess manager effectiveness. Analytics aggregates this data, identifying strengths and correlating manager performance with team outcomes.
Research shows that employees who recommend their manager are 64% more likely to be engaged and 75% more likely to feel a sense of belonging. Effective managers who connect business goals to employee actions can increase top performers from 44% to 60%.
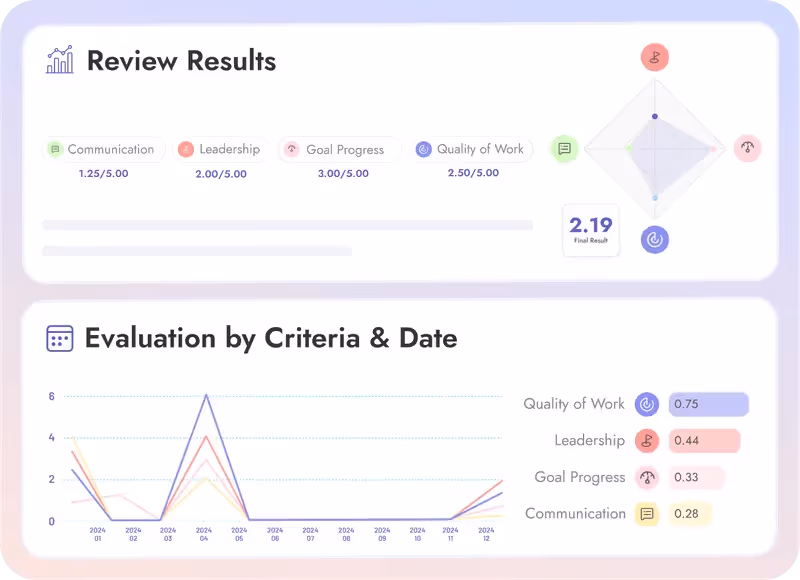
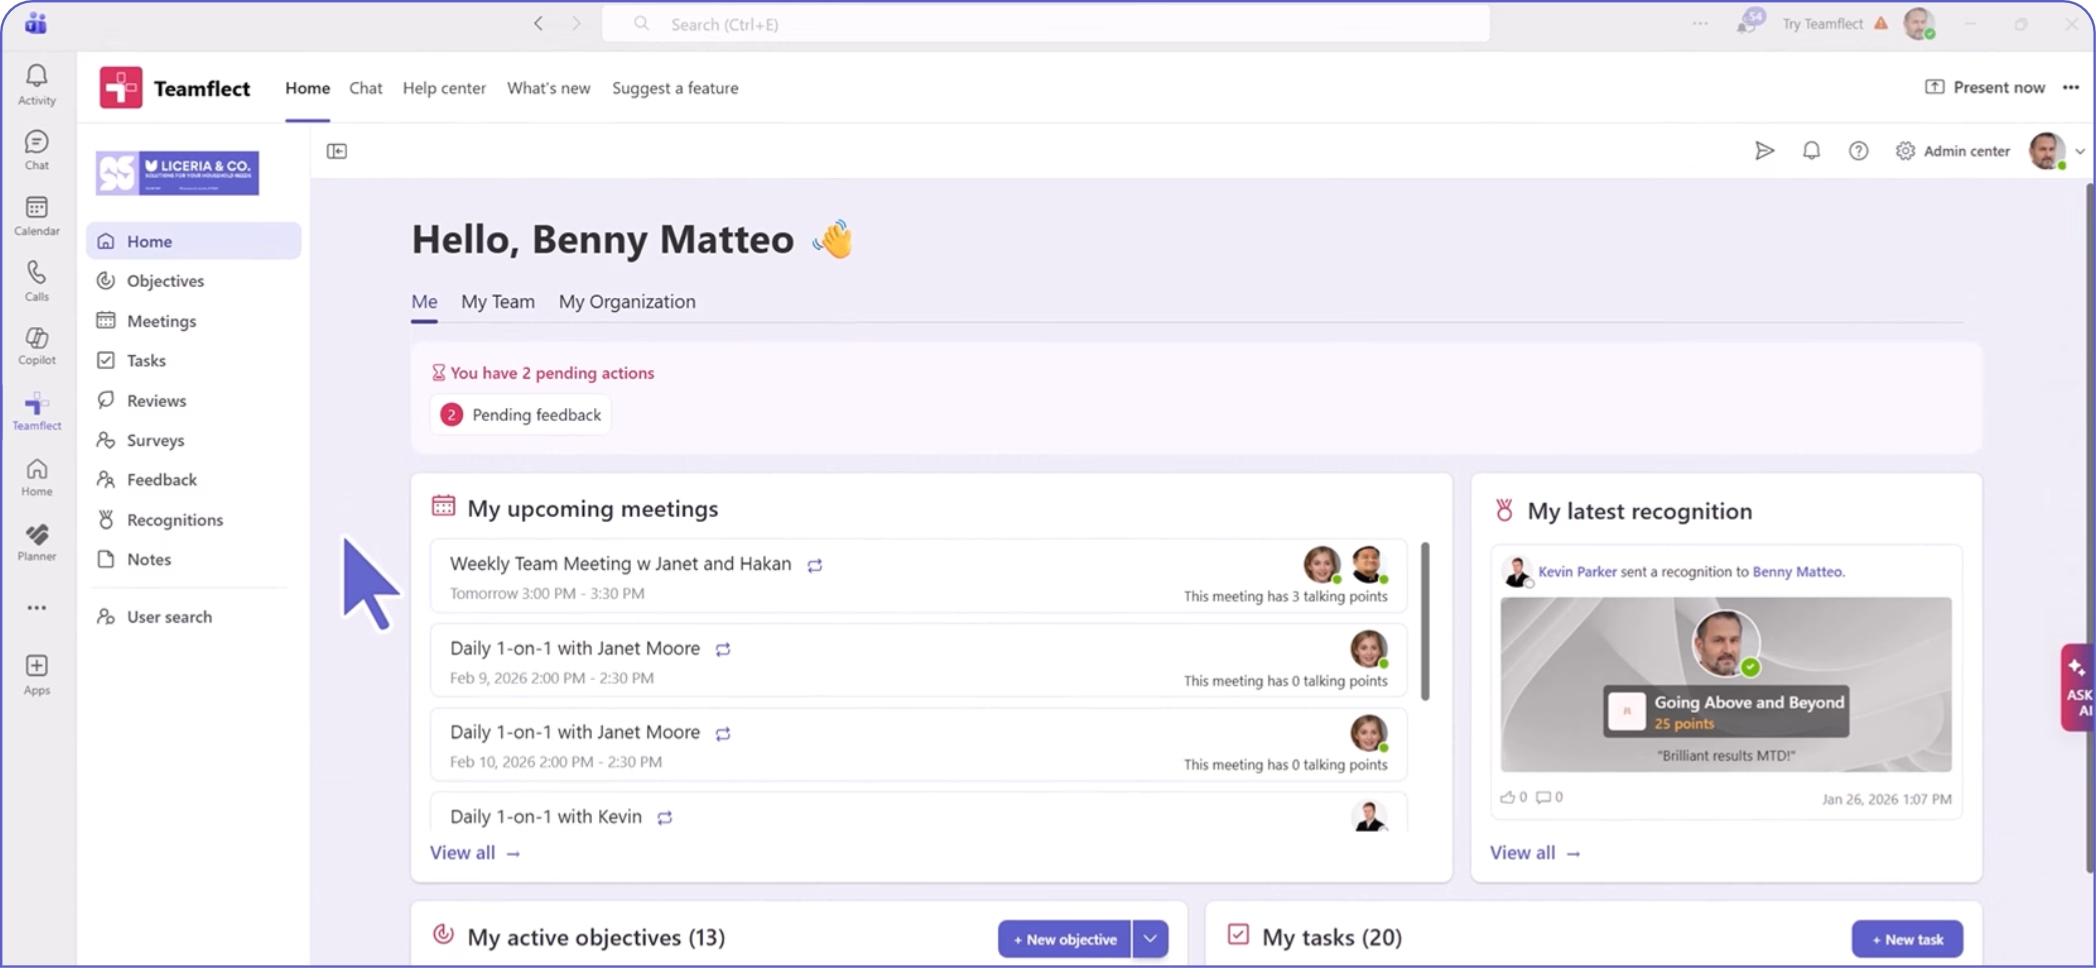
The best way to keep track of all the metrics listed above is to use an all-in-one performance management platform with strong, comprehensive HR reporting tool. As the highest-rated performance management software in the Microsoft 365 ecosystem, Teamflect not only offers all the capabilities listed above such as:
But also supports each of these modules with extensive analytics dashboards that are fully integrated into Power BI. This level of integration and performance analytics provides Teamflect users to make data-driven decisions when it comes to their most valuable asset: Their employees.
The platform’s individual development plan tool helps employees and managers collaborate on career growth by designing personalized development roadmaps, setting goals, and tracking progress seamlessly within Microsoft Teams.
Would you like to learn more? Let's jump on a quick call and we can walk you through how Teamflect can meet your performance analytics needs.
Effective data visualization transforms raw performance data into actionable insights. The right tools, like Power BI, Tableau, and Looker, enable HR professionals to create interactive dashboards that provide real-time insights into key metrics. The following table summarizes common visualization types, their use cases, and suitable tools:
Best practices for visualization include:
Performance management analytics empowers organizations to manage employee performance and achieve strategic results. By tracking metrics like those mentioned above and visualizing them with a performance management system like Teamflect, organizations can make data-driven decisions, enhance talent management, and boost performance.
In the dynamic environment that businesses, including small businesses, operate in, performance management analytics is the first step in keeping them competitive and building a high-performing workforce.
By setting goals that are time-bound, monitoring progress, and using analytics to identify areas for improvement, organizations can lead teams to success, offer support to employees, and assess performance to drive customer satisfaction.
.avif)
.svg)
.avif)
Create high-performing and engaged teams - even when people are remote - with our easy-to-use toolkit built for Microsoft Teams

_UsersMostLikelyToRecommend_Enterprise_Nps%201.svg)

.svg)
.svg)


.svg)
.svg)
.webp)